
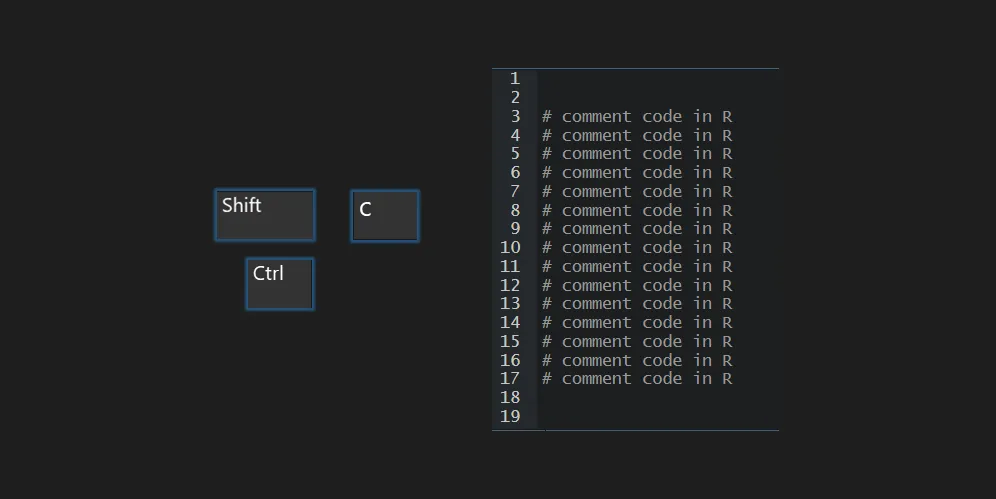
Here is how to comment out multiple lines in R by using the shortcut Ctrl + Shift + C or other techniques. In RStudio, you can comment and uncomment a block of code by using a shortcut or GUI. Commenting is very useful if you want to keep a peace code for later or experiment… Continue reading Comment out multiple lines in R or uncomment
How to find or set the working directory in R
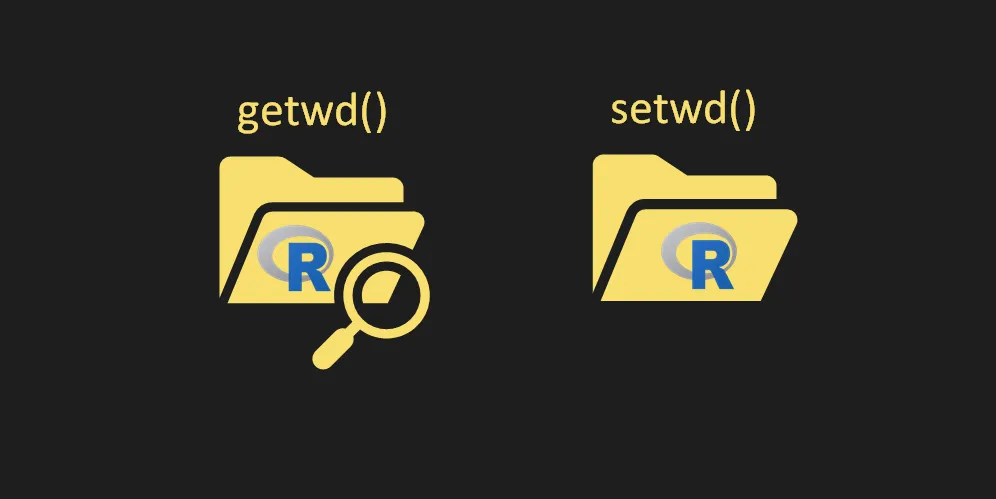
Sometimes it is necessary to find or set a working directory in R, even if you don’t necessarily want to. For example, if you are saving an R plot and do not understand where the result goes, it is necessary to look for that. You can do working directory detection or setup using the base… Continue reading How to find or set the working directory in R
How to adjust R ggplot2 axis to start at 0 or set other limits

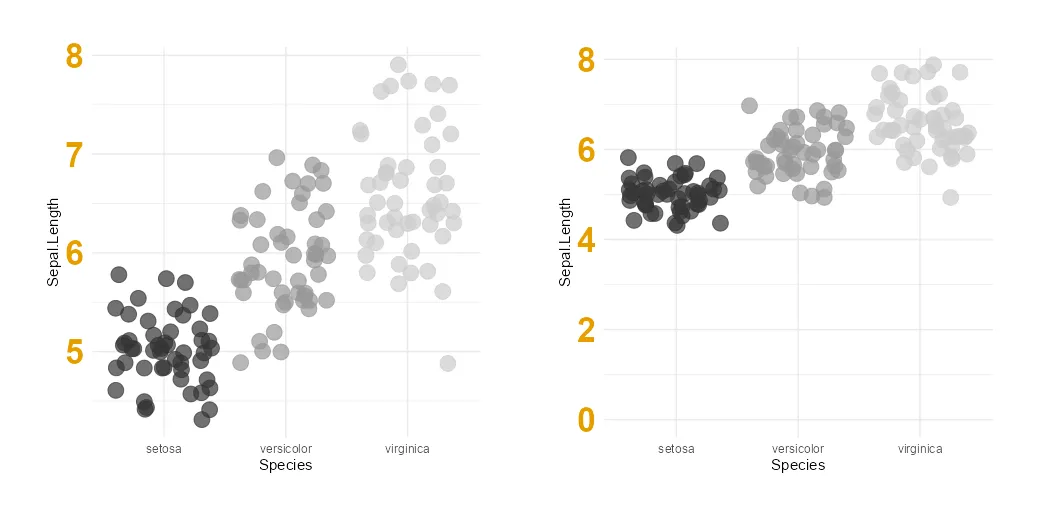
Here is how to change the beginning or end of the R plot axis or execute common adjustment – set the ggplot2 axis to start at 0. If it is not happening automatically, then you might want to force the origin of the R plot y-axis. A vertical axis beginning from zero is good practice… Continue reading How to adjust R ggplot2 axis to start at 0 or set other limits
How to generate time intervals in Excel

Sometimes it is necessary to generate time intervals in Excel to make sure that there are all of them. It is an easy and flexible way to do this by using the relatively new Excel function SEQUENCE.
Define and use variables in Excel formula by using LET function


You can use variables in the Excel formula, and you can do that by using the function LET. Alternatively, you can use Excel capabilities to define names, but the function LET allows you to store variables inside the formula. It might be easier to maintain that in the long run.
Round time in Excel

Here is how to round time in Excel in different ways depending on how necessary. For example, you can round time down or up to the nearest 15-minute interval.
Extract time from DateTime in Excel


The fastest way to extract time in Excel is by using the function MOD. The function MOD in Excel returns the remainder after a number divided by a divisor. In other words, you can extract decimals. The time part in DateTime is decimal numbers; by using MOD, you can get only the fractional part. By… Continue reading Extract time from DateTime in Excel
How to use an image in a chart background in R
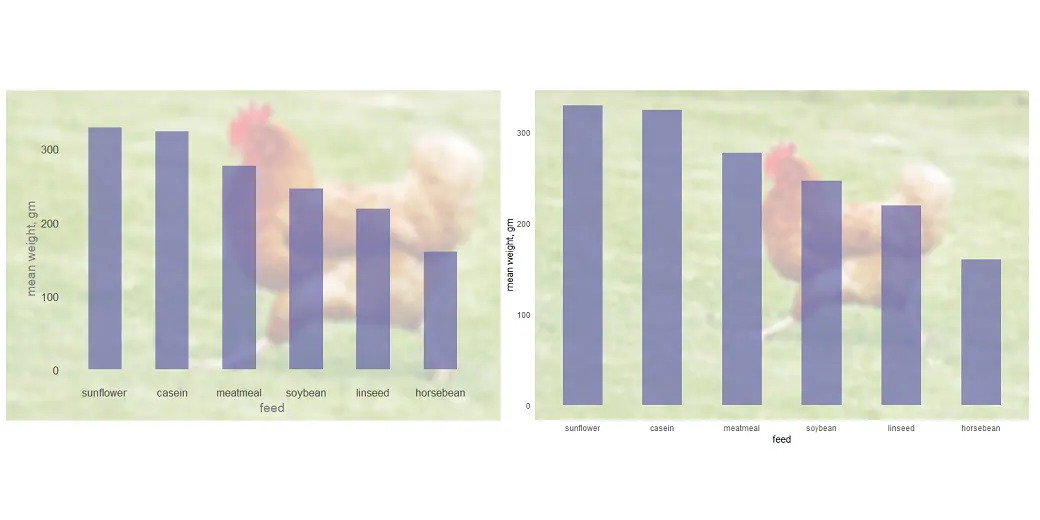
There are different ways how to use an image as the chart background in R. You can add that only in the panel background or plot background, or you can put the plot on top of the image.
Excel chart axis conditional formatting

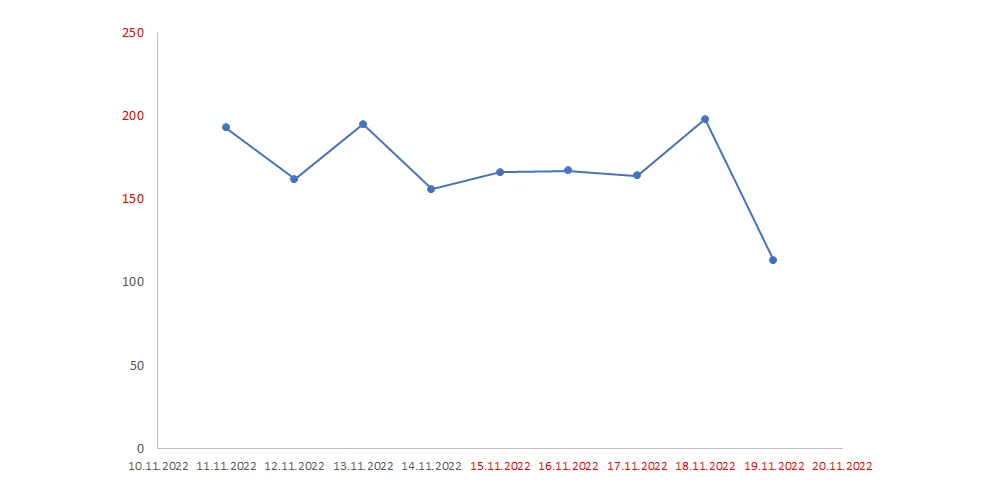
Here is how to create an Excel chart axis conditional formatting for necessary values using format code. It is relatively easy to do for the vertical axis, but it is also possible for the horizontal axis.
7 ways how to find or remove duplicates in Excel

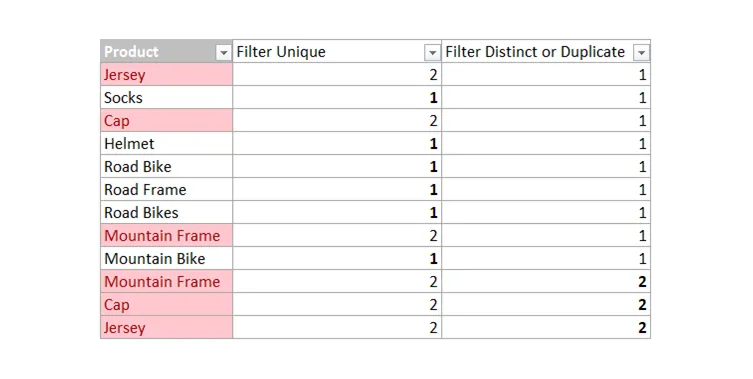
Here are seven ways how to find or remove duplicates in Excel that are helpful to do other necessary actions with data. For example, filtering, deleting, or fixing duplicates. Sometimes duplicates exist if there is something missing that makes records unique.