Here is how to change the beginning or end of the R plot axis or execute common adjustment – set the ggplot2 axis to start at 0. If it is not happening automatically, then you might want to force the origin of the R plot y-axis. A vertical axis beginning from zero is good practice in column charts but might also be necessary for scatter plots or other types.
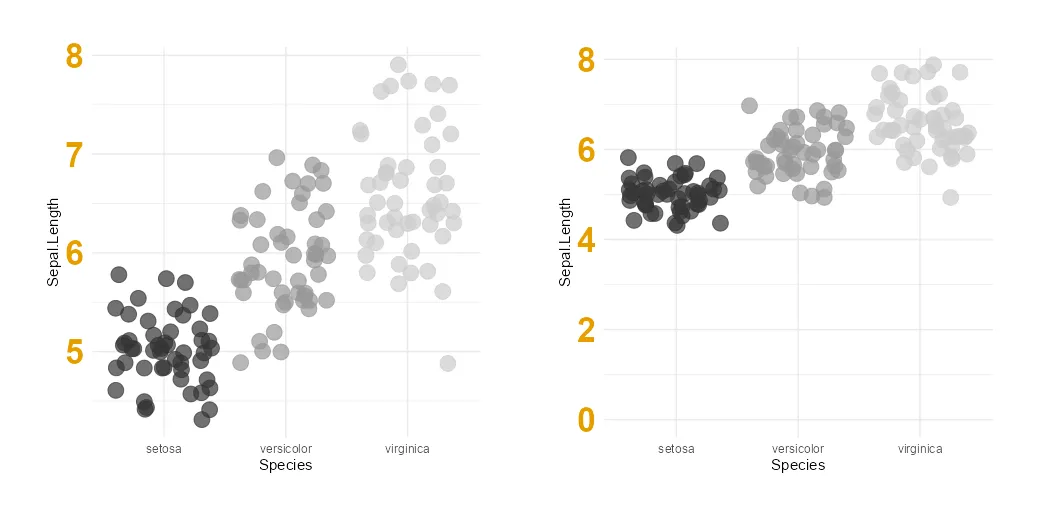
Here is a temporary scatter plot from ggplot2 with data from the iris dataset. There are little adjustments like a removed legend and others.
require(ggplot2)

ggplot(iris, aes(y = Sepal.Length, x = Species, color = Species))+
  geom_jitter(size = 5, alpha = 0.7) +
  scale_color_grey() +
  theme_minimal() +
  theme(legend.position = "none"
    , axis.text.y = element_text(size = 25, colour = "#E69F00", face="bold"))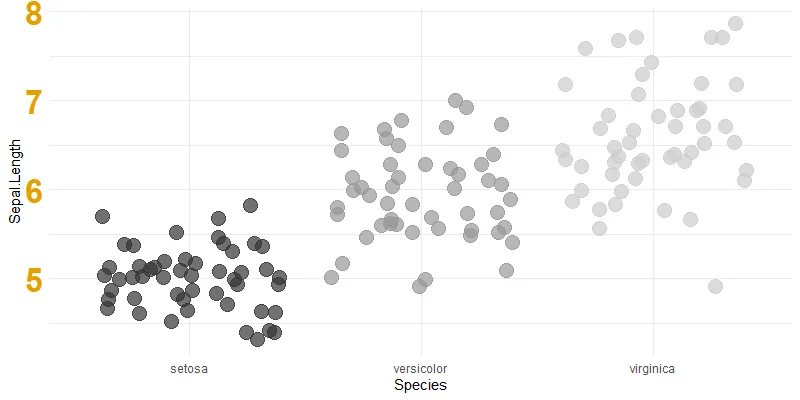
Adjust R ggplot2 axis to start at 0
Let’s say that you want to force that ggplot2 y-axis to start at 0. One of the easiest ways to change axis limits if you are using ggplot2 to create the desired visualization is by using limits.
When specifying limits, you can leave one value as NA, and that will be detected automatically. Here is how it looks when the y-axis origin starts at zero, and the upper limit is not specified.
ggplot(iris, aes(y = Sepal.Length, x = Species, color = Species))+
  geom_jitter(size = 5, alpha = 0.7) +
  scale_color_grey() +
  ylim(0, NA)+
  theme_minimal() +
  theme(legend.position = "none"
        , axis.text.y = element_text(size = 25, colour = "#E69F00", face="bold"))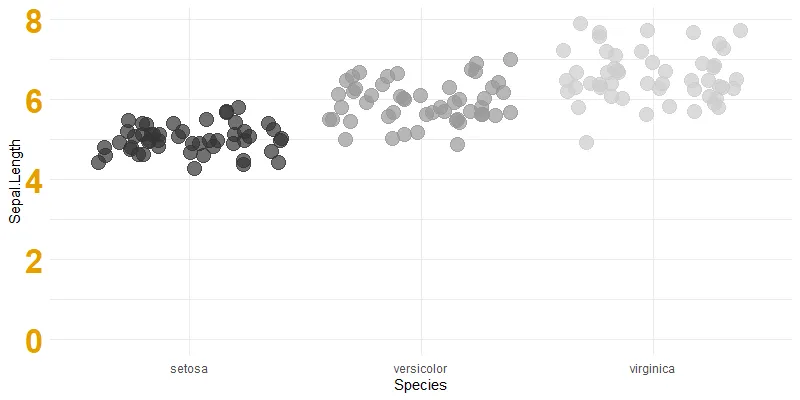
You can set the upper limit, but there might be situations when you do not know that exactly.
ggplot(iris, aes(y = Sepal.Length, x = Species, color = Species))+
  geom_jitter(size = 5, alpha = 0.7) +
  scale_color_grey() +
  ylim(0, 10)+
  theme_minimal() +
  theme(legend.position = "none"
        , axis.text.y = element_text(size = 25, colour = "#E69F00", face="bold"))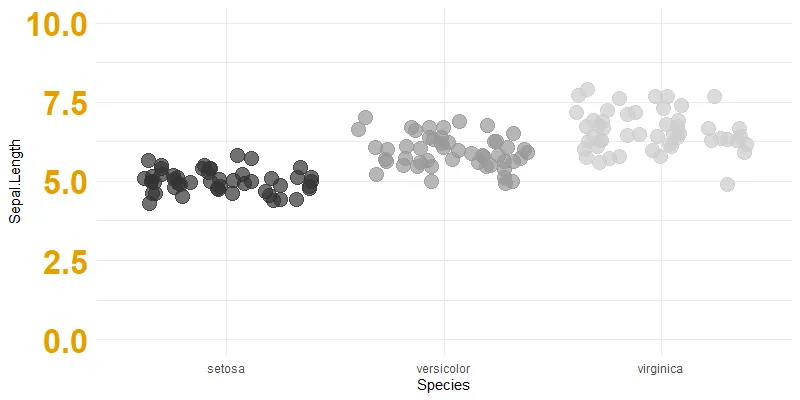
It is also possible to adjust axis limits another way. For example, if you want to do that for the vertical axis, try scale_y_continuous.
ggplot(iris, aes(y = Sepal.Length, x = Species, color = Species))+
  geom_jitter(size = 5, alpha = 0.7) +
  scale_color_grey() +
  scale_y_continuous(limits = c(0, 10))+
  theme_minimal() +
  theme(legend.position = "none"
        , axis.text.y = element_text(size = 25, colour = "#E69F00", face="bold"))
Adjusting the R plot axis limits or beginning at 0 in other R packages
If you want to create the R plotly plot with the vertical axis origin at zero, here is an easy way to do that. Create desired pot in ggplot2 and use the ggplotly function from the plotly to transform that to the desired result.
x <- ggplot(iris, aes(y = Sepal.Length, x = Species, color = Species))+
  geom_jitter(size = 5, alpha = 0.7) +
  scale_color_grey() +
  ylim(0, NA)+
  theme_minimal() +
  theme(legend.position = "none"
        , axis.text.y = element_text(size = 25, colour = "#E69F00", face="bold"))

plotly::ggplotly(x)
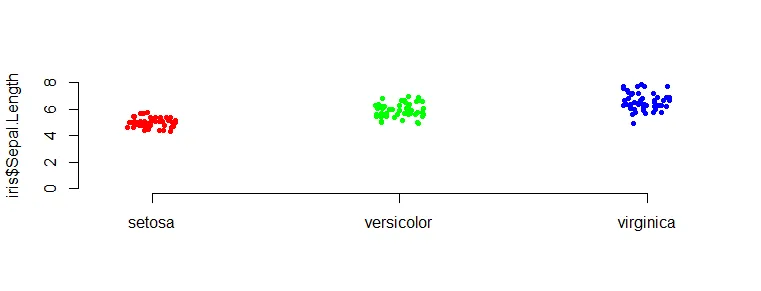
If you are using base R and want to set the origin of the axis at zero, then the problem is with the upper limit. Error message “need finite ‘ylim’ values” appears.
One of the ways is to calculate one of the limits by using additional rounding as below.
stripchart(
  iris$Sepal.Length ~ iris$Species,
  vertical = TRUE,
  pch = 20,
  cex = 1.1,
  col = c("red", "green", "blue"),
  method = "jitter",
  ylim = c(0, ceiling(max(iris$Sepal.Length))),
  frame.plot = FALSE
)
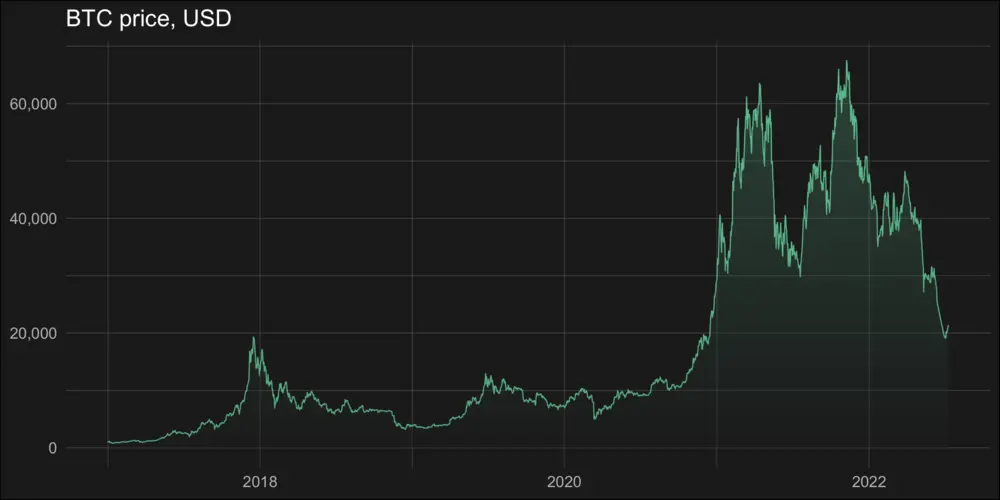
Thank you for reading this post and please take a look at other posts from this blog about data visualization or other stuff. For example, how to create a line chart with gradient fill underneath the line like below.
Leave a Reply