Tag: ggplot start y axis at 1
How to adjust R ggplot2 axis to start at 0 or set other limits
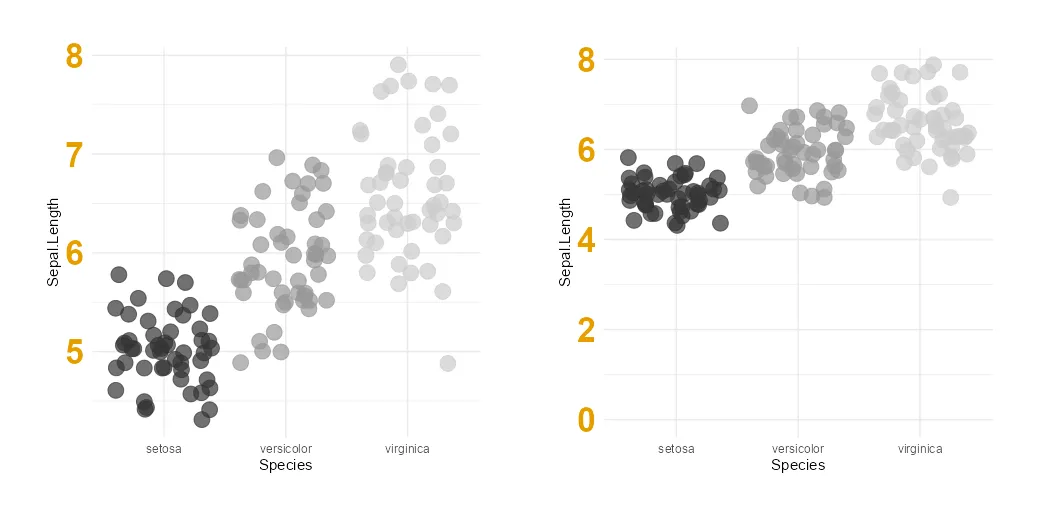
Here is how to change the beginning or end of the R plot axis or execute common adjustment – set the ggplot2 axis to start at 0. If it is not happening automatically, then you might want to force the origin of the R plot y-axis. A vertical axis beginning from zero is good practice…