Category: Excel
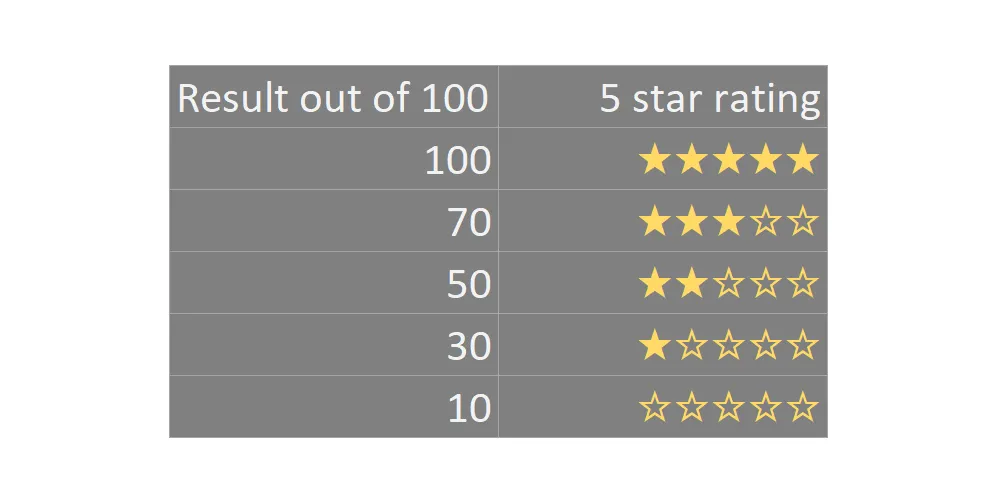
Create star rating in Excel or Power BI using DAX
Here is a simple solution to create a five star rating in Excel using formulas or Power BI using DAX. The result is obtainable using only Excel formulas or DAX capabilities. You can do that with other symbols or emojis too. With the same techniques, it is possible to create a progress bar in Excel…
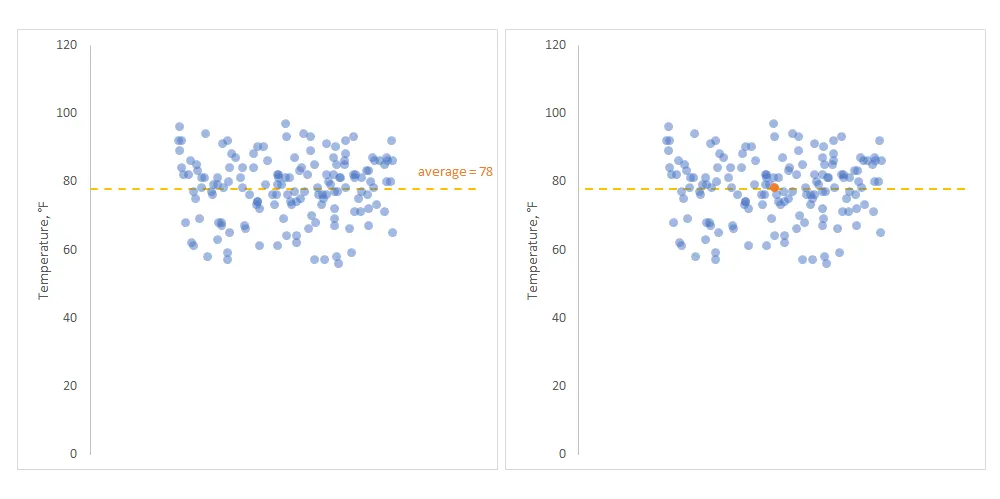
Jitter chart in Excel with average line
A jitter chart in Excel is a beautiful way to use a scatterplot and randomly distribute data points to make them more visible. In other words, if your problem is overlapping data points in Excel, this might be a good solution.

Excel PERSONAL.XLSB location in Windows
If you are looking for Excel PERSONAL.XLSB location in Windows, I assume you already know why it is helpful. The Personal Macro Workbook file location is in the XLSTART folder. Here is the simplest way how to find that and solve other problems.
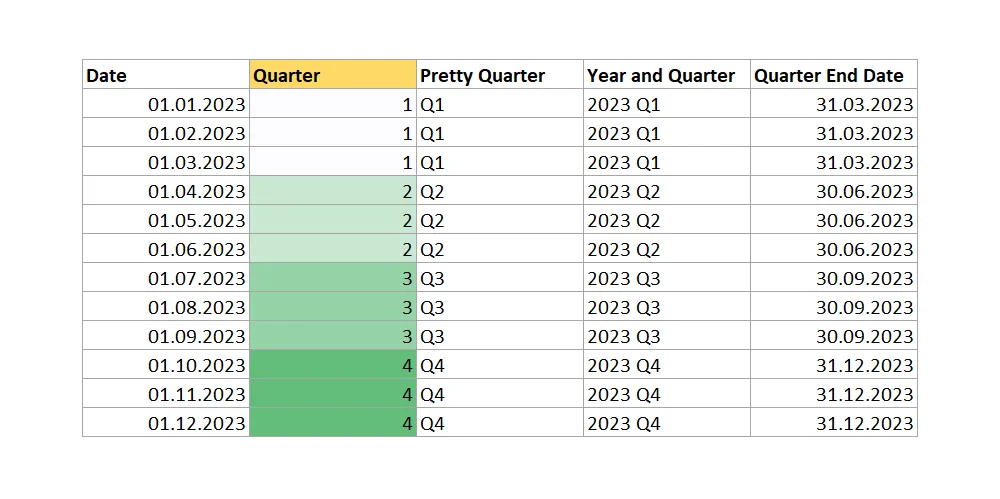
Get quarter in Excel from date – fast and easy
As usual in Excel, there is more than one way to get identical results, and the same happens if you try to get a quarter in Excel from date. Excel has multiple functions to do calculations with dates, but at this point, none of them are for quarter calculation.

Get the user name in an Excel cell with a formula or VBA macro
If you want to get the Windows user name in an Excel cell, there are at least two ways to do that. By using an Excel formula to return the username, you will get dynamic results depending on who will open the file. Otherwise, you can return the same with VBA and a simple Excel…

How to generate time intervals in Excel
Sometimes it is necessary to generate time intervals in Excel to make sure that there are all of them. It is an easy and flexible way to do this by using the relatively new Excel function SEQUENCE.

Define and use variables in Excel formula by using LET function
You can use variables in the Excel formula, and you can do that by using the function LET. Alternatively, you can use Excel capabilities to define names, but the function LET allows you to store variables inside the formula. It might be easier to maintain that in the long run.

Round time in Excel
Here is how to round time in Excel in different ways depending on how necessary. For example, you can round time down or up to the nearest 15-minute interval.

Extract time from DateTime in Excel
The fastest way to extract time in Excel is by using the function MOD. The function MOD in Excel returns the remainder after a number divided by a divisor. In other words, you can extract decimals. The time part in DateTime is decimal numbers; by using MOD, you can get only the fractional part. By…
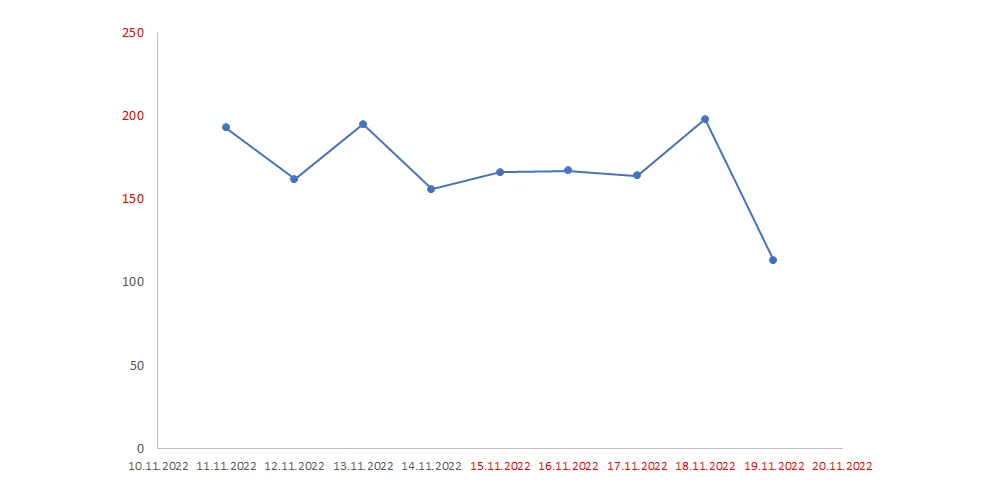
Excel chart axis conditional formatting
Here is how to create an Excel chart axis conditional formatting for necessary values using format code. It is relatively easy to do for the vertical axis, but it is also possible for the horizontal axis.