Here is how to create a jitter chart in Power BI with averages by categories and using only Power BI and DAX capabilities. No custom visualizations are necessary. A jitter chart makes it easier to view overlapping data points by categories.
If you want to understand this technique in more detail, look at this post from this blog that contains an example in Excel. The main principle of creating a jitter plot is the same.
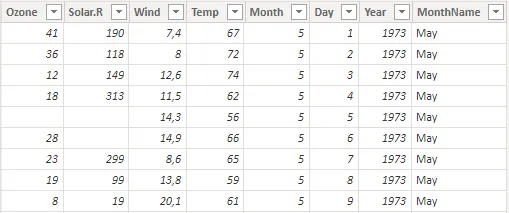
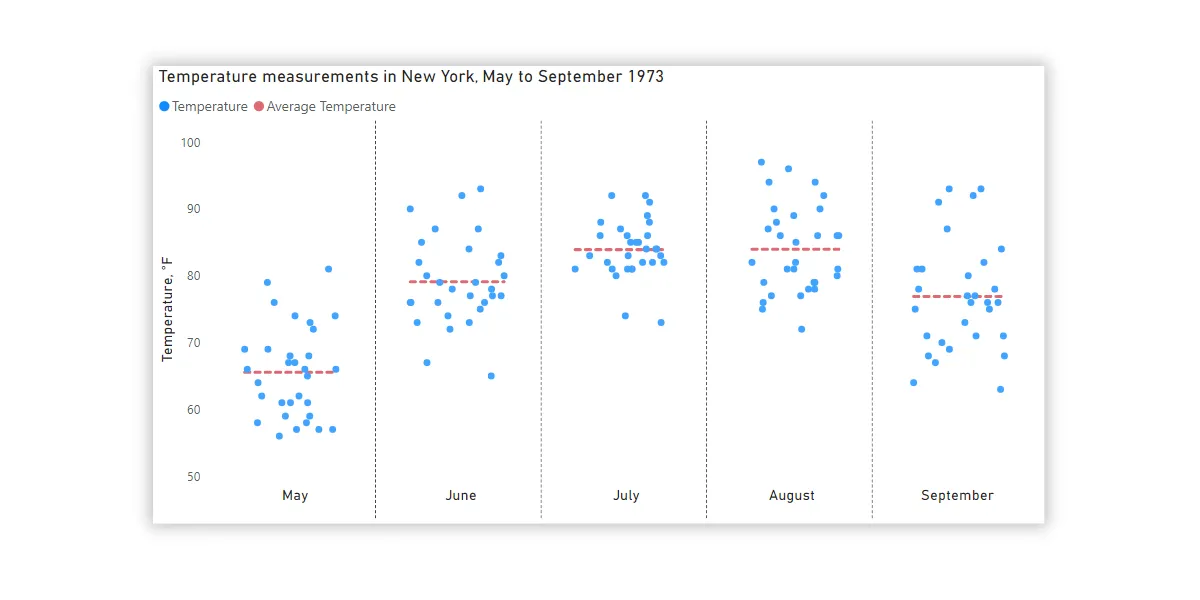
In this example, I’m using data from this data set that contains daily temperature measurements in New York from May to September 1973.
If you want to obtain that, you can use this M code in the blank query or download the pbix file with the result.
Here is my data and M code for that. The table name is air quality. I would like to visualize temperatures by month. The month name column is sorted by the column that contains the month number.
let
    Source = Table.FromRows(Json.Document(Binary.Decompress(Binary.FromText("dVhbchsxDLvLfnc8EvU+S6b3v0YtgC+77Uc8iamlSBAgufn5eXp9fj31lPfnevX351zvj3G/fH7/+nnavL/W/f68P0vUKrDW+2ft537K6x5dXQ80HrgPtdrg5HW/n+ah48D7F7h43SNjqm3AJtut94Zp1knrfULOtWxcPYfaF6++Fphre11P46h9w76R+PVRXheEWdV8LLB6eji3h2uBeTG0icg86UrQ6n1CkM15rY+nFbeK2AsOSM6tKm7Xo8BvLcx+24keyE4+AhfDD4xw0VpP0HuYRBC2VhbjykEQQdQTMG1QYzg1iGC78TeRdIPHcCLP3gMHpw9RrEorWr1AUuPpJgURk13NThBHoDTCvZVQiGK71x3x/Nzs3EPK6tzTk2FmoZ38c4BlJurujydXUJOkx71uJm6dl0i43h6Z4cYkkS5SW4ZNI3Jt4TqwD8VZVrxWPfo9nb+oI5IJ63LgQDSQ1q1diEy1BK65uTT2dO5ue9hRFdSMF++h1gRqf1zyyAACI3JsJRHZFrUvfxwkoPC2BUZgF2VVH9c8JIZQidoBo1I7cg+qa1QGQVB2p5k9gBuh22PhqbDpulu79OirI9dASg1vW3jVsfvQk6OjmhZ26xrMWR7/TLxASd59DbX1GJScUO3yFKYVSFXNnk7VaRSOgbKT9F5EqRn5wB9HsQKlSbMFKQ4iMWaA/rCzDxl2Etet7bMA8+tmR7C2ofAvSy0UTW7trIiQc88pWdLizDs78cYqp5p+ILy/yyIxTZqzwlyrlhmwYEh0CA71QzBsGBhTfXvN9lC7RJ+TliRZ1R6CLTVI7e6JGfUIsIg5AmTTwvVgTE3DyA8QusVmBJUz/q12YndgZxcBuJANCxF27haghNuJ3h4eIJvdPoZP8K3FJrDtcZvH5fluO5aA6Xb5Dbkl49vgXRbecXv3hQAV0htAENgVxI0YyNzPC1S5HCA9KBhp6DxGe2ND5QGnifY/iAotTeuw7ACBnNiZsraDSSVWl+VBLrtBUvuLie05hHTljOTdMlDxAhRJa9W261S+tQAmtNH9Ed6I5oVbvyqtIsZQ3T7xwz0RhEXQv5RIRlSVMTqLZKa5hxNakZE8GJNUzGhsMrjzfGqxxgzaaYbZEkQzpf7EiDCzpPqsuF7UTICXrszqeqqxB8PiSeuSRBabzuMdwLrk1JkA4Ab3dtUfoQOsCFpOUBdzl/2O+wxwLebVzd4dBTewqMdyyupeiVWWlsobC2Y98q8TEm8SXBwyM3GCwHGTHmnxsBBjNM+0Sy9DwCYziFgDgWW5qry53GKbisUH9rwz1mDe8hx024b6e+rCywaKqltxKCkIO6Hqxv6g+81gHhamBP2aLr3wYDglhQ++yXA8G4tU4dxtIb4Ti+t+QuGTp8FZEtEZTihRJqnm2GsZc7qOWIy3p0gcF9eQ5gEcz9C4yHQQKMna7YSOG2i8pXFlIajGOY9w8/z0oBo/3Miij2JaAPaQaT3RqEFeqCggqGgSwj22qZ0ocxBtLgwz2wkyFpmTuthS8/h+LyILkDF3Te+y+oKiA7/ogURWnSOJaSx1EK2VRNahB4ixdGei8sQyUNF3FiG9f23HsP6PzNNOZNm3qNMyHFT10Ww1SL+ip0235o3cT+hYn4krLkocmPGeLrmjTw9ixSXyvU1zlCes2o4T0y85MRWkmJC2s6mkG+iAsp1WcJW9vrc8NrQ8TZU969BSh/dqqPCx/yT7PGZXKPlKAmAYghVcZU+ynBiMyziXhN/TPzy8mKp8Lqi2o7XMOZM+G77B5Dir7kn7/HboOF/h//4D", BinaryEncoding.Base64), Compression.Deflate)), let _t = ((type nullable text) meta [Serialized.Text = true]) in type table [Ozone = _t, Solar.R = _t, Wind = _t, Temp = _t, Month = _t, Day = _t]),
    #"Changed Type" = Table.TransformColumnTypes(Source,{{"Ozone", Int64.Type}, {"Solar.R", Int64.Type}, {"Wind", type text}, {"Temp", Int64.Type}, {"Month", Int64.Type}, {"Day", Int64.Type}}),
    #"Replaced Value" = Table.ReplaceValue(#"Changed Type",".",",",Replacer.ReplaceText,{"Wind"}),
    #"Year Column" = Table.AddColumn(#"Replaced Value", "Year", each 1973),
    #"MonthName Column" = Table.AddColumn(#"Year Column", "MonthName", each Date.MonthName(#date([Year], [Month], [Day]), "en-US")),
    #"Changed Type1" = Table.TransformColumnTypes(#"MonthName Column",{{"Wind", type number}, {"MonthName", type text}, {"Year", Int64.Type}})
in
    #"Changed Type1"
Jitter chart in Power BI
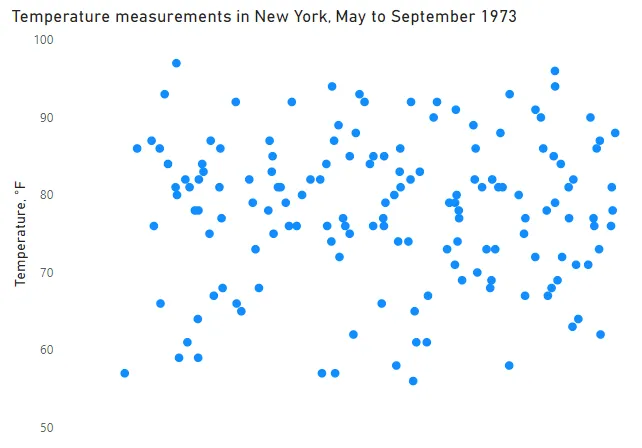
Usually, with the jitter chart, I will look at the modified scatter chart. At this moment, Power BI is not flexible enough. In my scenario, I would like to show Power BI jitter plots by month name category. I will use a line chart with only markers and small multiples.
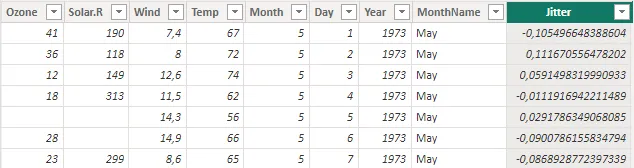
Within each category, data points should be separated to avoid overlap. To do that, you can calculate jitter like this. You can divide jitter or multiply with a decimal number to acquire optimal dispersion. Try to provide a divisor by using the what-if parameter, like in this example.
Jitter = (RAND()-0.5)/3
The next step is to create a line chart with markers and remove the line (0 px stroke), x-axis content, and unnecessary elements.
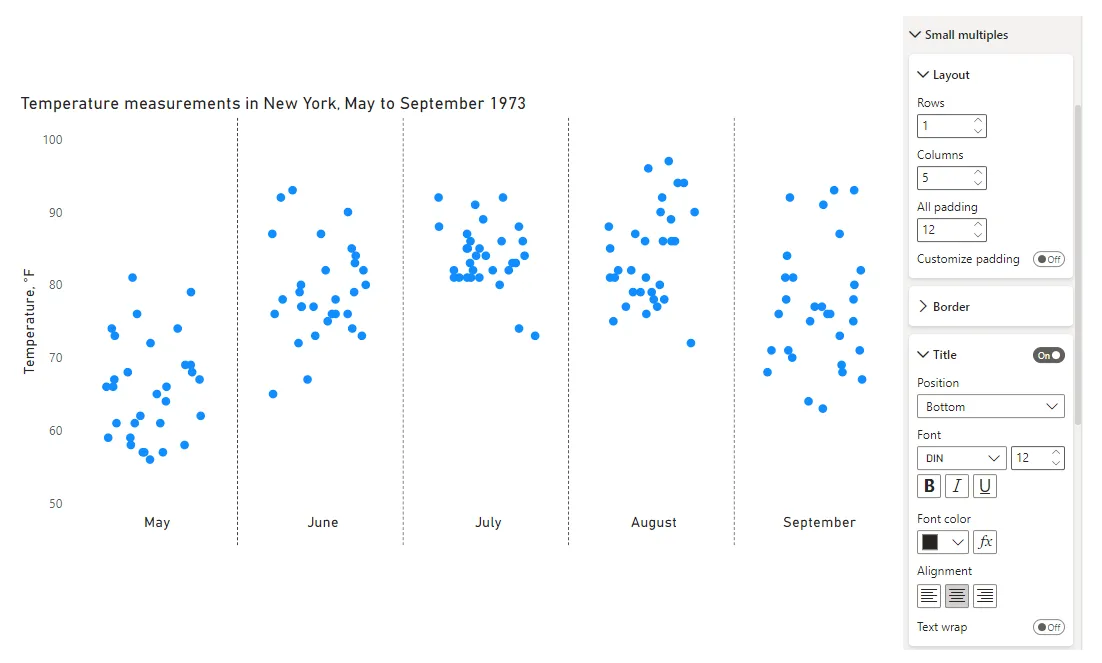
Now add the category to the small multiples section, arrange small multiples in one row (you can do that by adjusting the column count that equals the category count), and do some formatting.
Average line by categories in Power BI
You might be happy with the jitter plot in Power BI as it is, but here is how to add additional measures by category. Here is how to create a measure of averages, ignoring the jitter within each category using the REMOVEFILTERS function.
Average Temperature =
CALCULATE ( AVERAGE ( airquality[Temp] ), REMOVEFILTERS ( airquality[Jitter] ) )
Add this to Y-axis values and format.
If you want something more complex, try to use R script visuals. In this blog, you can find a couple of examples.
Here is a simple R jitter plot by categories, and here is another with additional measures.
Here is a jitter plot with the average line in Excel.
Leave a Reply