Here is how to add GIF animation to the plot in R and draw extra attention. You can take a static ggplot2 plot and join it with GIF frames. As a result, you can create GIF in R with an infinite or finite loop.
Here is a dataset from one of the previous posts about adding an image in the ggplot2 background.
require(dplyr)

cw <- chickwts %>%
  group_by(feed) %>%
  summarise('mean_weight' = round(mean(weight), digits = 0)) %>%
  arrange(desc(mean_weight)) %>%
  mutate('feed' = factor(feed, levels = feed))

cw

## A tibble: 6 x 2
#  feed      mean_weight
#
#1 sunflower         329
#2 casein            324
#3 meatmeal          277
#4 soybean           246
#5 linseed           219
#6 horsebean         160
That is how it looks in a simple R plot.
require(ggplot2)

cw %>%
  ggplot(aes(x = feed, y = mean_weight)) +
  geom_col(fill = "#6667AB",
           width = 0.5,
           alpha = 0.7) +
  labs(
    title = "the effectiveness of various feed supplements",
    subtitle = "on the growth rate of chickens after six weeks",
    x = "feed type",
    y = "mean weight (grams)") +
  theme_minimal() +
  theme(panel.grid = element_blank(),
        axis.title.x = element_text(size = 10),
        axis.title.y = element_text(size = 10))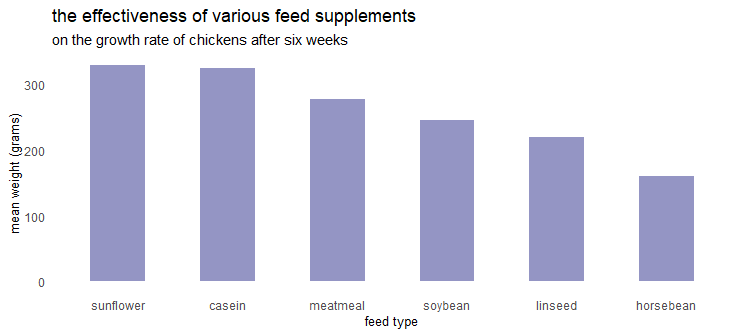
The next thing is a GIF with transparent background. You have to imagine how it will look together with the plot. Here is the GIF with the chicken that I used.
By using the function image_read from package magick, you can read that into the R like this.
require(magick)

gif <- image_read("https://media.giphy.com/media/ot3LS5MDy1V4hzSmBT/giphy.gif")

gif
It is a little bit too big for my plot, and I reduced the size of the image.
gif <- gif %>% image_scale("200")

gif
This GIF contains 55 frames, and here is how to measure that.
length(gif)

#[1] 55
In order to combine the GIF with the plot, it is necessary to write the ggplot2 result into the magick object. I adjusted the border around the plot to better incorporate that with the chicken GIF.
p <- cw %>%
  ggplot(aes(x = feed, y = mean_weight)) +
  geom_col(fill = "#6667AB",
           width = 0.5,
           alpha = 0.7) +
  labs(
    title = "the effectiveness of various feed supplements",
    subtitle = "on the growth rate of chickens after six weeks",
    x = "feed type",
    y = "mean weight (grams)") +
  theme_minimal() +
  theme(panel.grid = element_blank(),
        axis.title.x = element_text(size = 10),
        axis.title.y = element_text(size = 10),
        plot.margin = margin(0.5, 0.5, 1.5, 1.5, "cm"))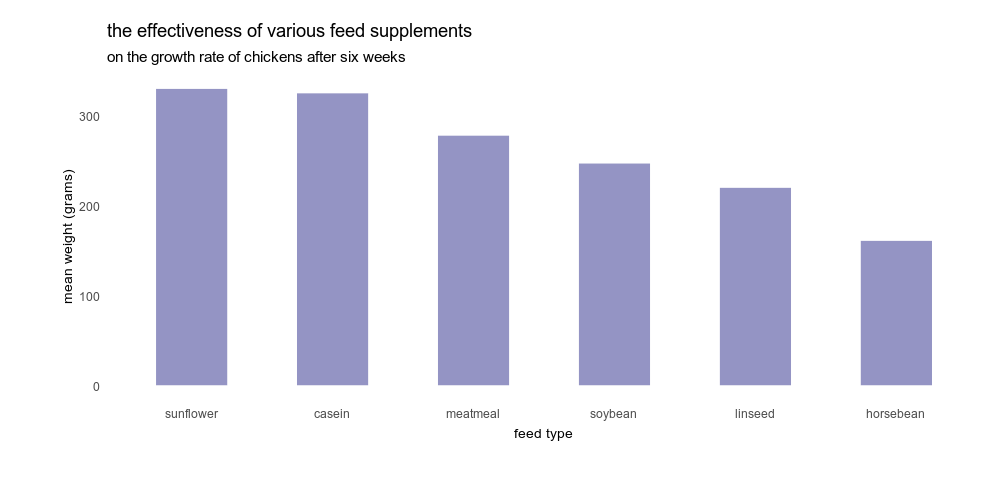
Here is how to write a ggplot2 plot into the magick object.
plot <- image_graph(width = 1000, height = 500, res = 100)

p

dev.off()
Add GIF animation to plot in R
After that, you have two magick objects, and you can put them on top of each other. It is necessary to experiment with the offset argument. Here is more about that process.
frames <- image_composite(plot, gif, offset = "+0-350")
Try to use the optimize argument to get a smaller file size. You can reduce GIF file size in R even more by reducing the number of colors in frames with image_quantize. You can view the animation in R or write it into a GIF file.
animation <- image_animate(image_join(frames), optimize = TRUE)

animation <- image_quantize(animation,
                            max = 20,
                            colorspace = "rgb")

image_write(animation, "C:\\Users\\dc\\Downloads\\chicken.gif")
If you want to stop GIF from looping in R, you can specify that with the loop argument in the function image_write.
animation <- image_animate(image_join(frames), optimize = TRUE, loop = 1)

animation <- image_quantize(animation,
                            max = 20,
                            colorspace = "rgb")

image_write(animation, "C:\\Users\\dc\\Downloads\\chicken_no_loop.gif")
Open this image in a new tab to see how it works.
Please look at other visualizations in this blog made using R. For example, gradient line chart, glowing line chart, and gradient word cloud.
Leave a Reply