The glow effect in the R plot might be one of those adjustments that someone uses rarely. Meanwhile, neon luminescence adds a special feel to the diagram. Almost like from sci-fi movie. Here is how to add the glow effect in the R plot by using two solutions.
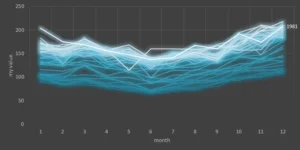
By the way, here is an example of how to get the same effect in Excel.
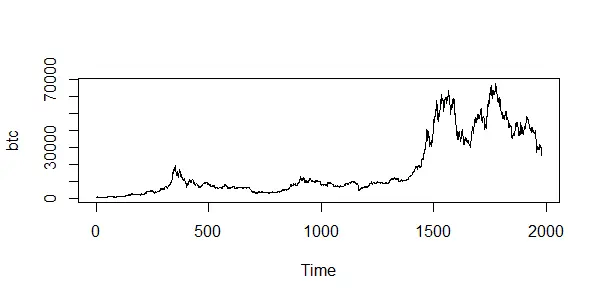
In this post, I used Bitcoin price data with the help of the coindeskr package. Here is how it looks in a simple line chart without special formatting.
require(coindeskr)

btc <- get_historic_price(start = "2017-01-01")

ts.plot(btc)

btc$Date <- as.Date(row.names(btc))
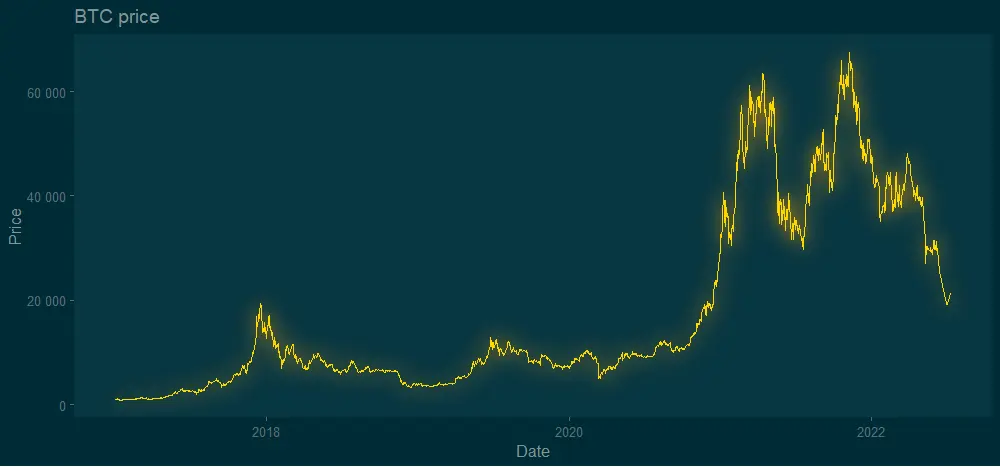
Add glow effect in R using ggshadow package
The glow effect is similar to a shadow directly behind data points. Meanwhile, the ggshadow package has something directly related to glowing. There is a ton of possibilities to work with other types of plots and effects that you can find in the vignette.
In addition, I will use theme_solarized_2 from the ggthemes. Neon luminescence looks better on the dark background.
require(ggshadow)
require(ggplot2)
require(ggthemes)


ggplot(btc, aes(x = Date, y = Price)) +
  geom_glowline(color = "gold", shadowcolour = "orange") +
  scale_y_continuous(
    labels = function(x)
      format(x, big.mark = " ", scientific = FALSE)
  ) +
  theme_solarized_2(light = FALSE) +
  theme(panel.grid.major = element_blank(),
        panel.grid.minor = element_blank()) +
  ggtitle("BTC price")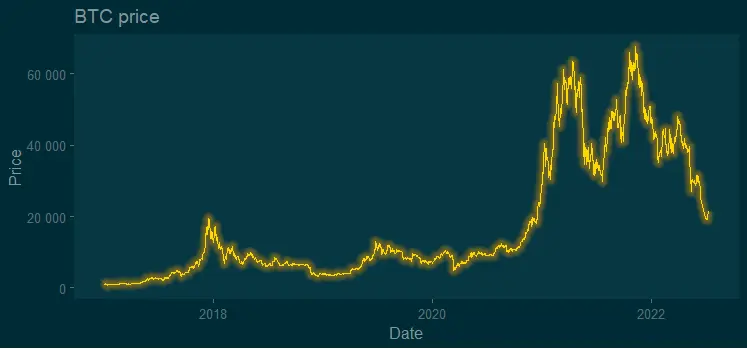
Argument shadowcolor, by default, comes in the same color as the line, but you can specify another one as I did. You can change the size of the glow with shadowsize and shadowalpha.
ggplot(btc, aes(x = Date, y = Price)) +
  geom_glowline(
    color = "gold",
    shadowcolour = "orange",
    shadowsize = 0.9,
    shadowalpha = 0.03
  ) +
  scale_y_continuous(
    labels = function(x)
      format(x, big.mark = " ", scientific = FALSE)
  ) +
  theme_solarized_2(light = FALSE) +
  theme(panel.grid.major = element_blank(),
        panel.grid.minor = element_blank()) +
  ggtitle("BTC price")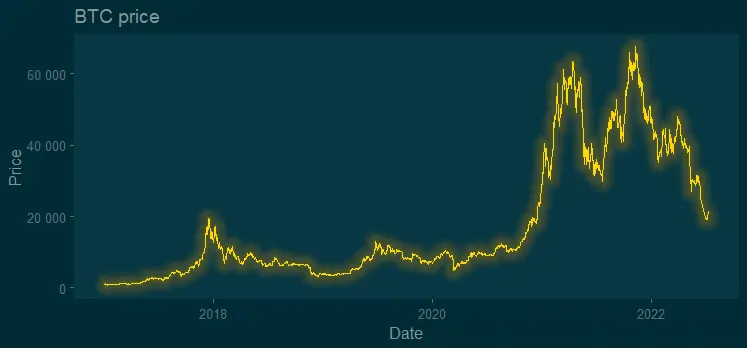
Here you can find out more about other adjustments and variations with the glow effect by using the ggshadow package.
Add glow effect in R using ggfx package
You can use the glow effect by using the ggfx package in combination with ggplot2. You can get a little bit different result compared with the ggshadow, and in a good way. The glow looks a little bit closer to natural.
require(ggfx)
require(ggplot2)
require(ggthemes)


ggplot(btc, aes(x = Date, y = Price)) +
  with_outer_glow(
    geom_line(color = "gold"),
    colour = "orange",
    sigma = 10,
    expand = 0.7
  ) +
  scale_y_continuous(
    labels = function(x)
      format(x, big.mark = " ", scientific = FALSE)
  ) +
  theme_solarized_2(light = FALSE) +
  theme(panel.grid.major = element_blank(),
        panel.grid.minor = element_blank()) +
  ggtitle("BTC price")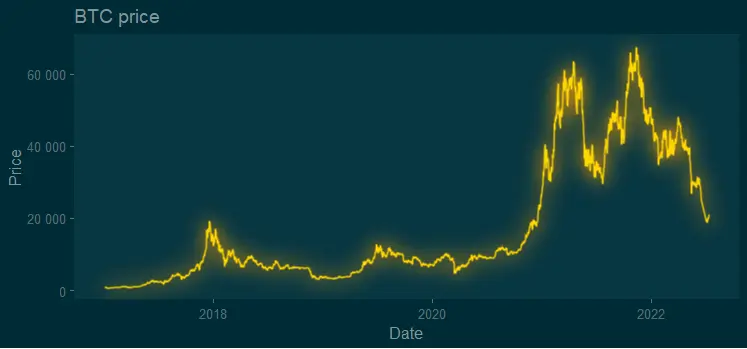
There are multiple possibilities to customize glow, for example, from inner to outer glow. You can do that even for data labels. If you like a result that looks more crisper than the previous one, try shadow without offset like this.
ggplot(btc, aes(x = Date, y = Price)) +
  with_shadow(
    geom_line(color = "gold"),
    colour = "orange",
    x_offset = 0,
    y_offset = 0,
    sigma = 10
  ) +
  scale_y_continuous(
    labels = function(x)
      format(x, big.mark = " ", scientific = FALSE)
  ) +
  theme_solarized_2(light = FALSE) +
  theme(panel.grid.major = element_blank(),
        panel.grid.minor = element_blank()) +
  ggtitle("BTC price")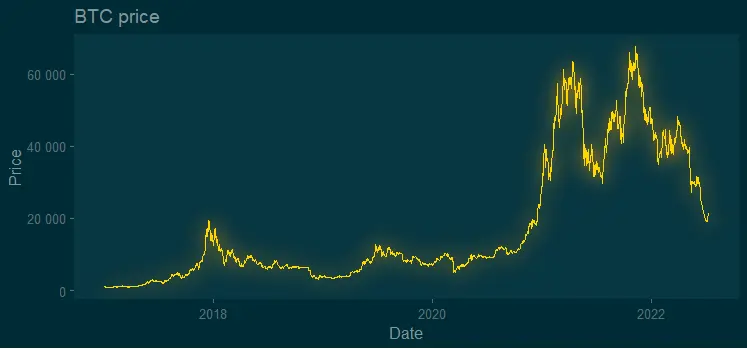
Here you can find out more about other adjustments and variations with the glow effect by using the ggfx package.
Additional ideas for R plots
It is worth mentioning the glow package as a third option to try in visualizations with a glow effect. I found it not so easy to use, but worth trying.
Look at other visualizations in this blog made using R. For example, gradient line chart and gradient word cloud.
Leave a Reply