
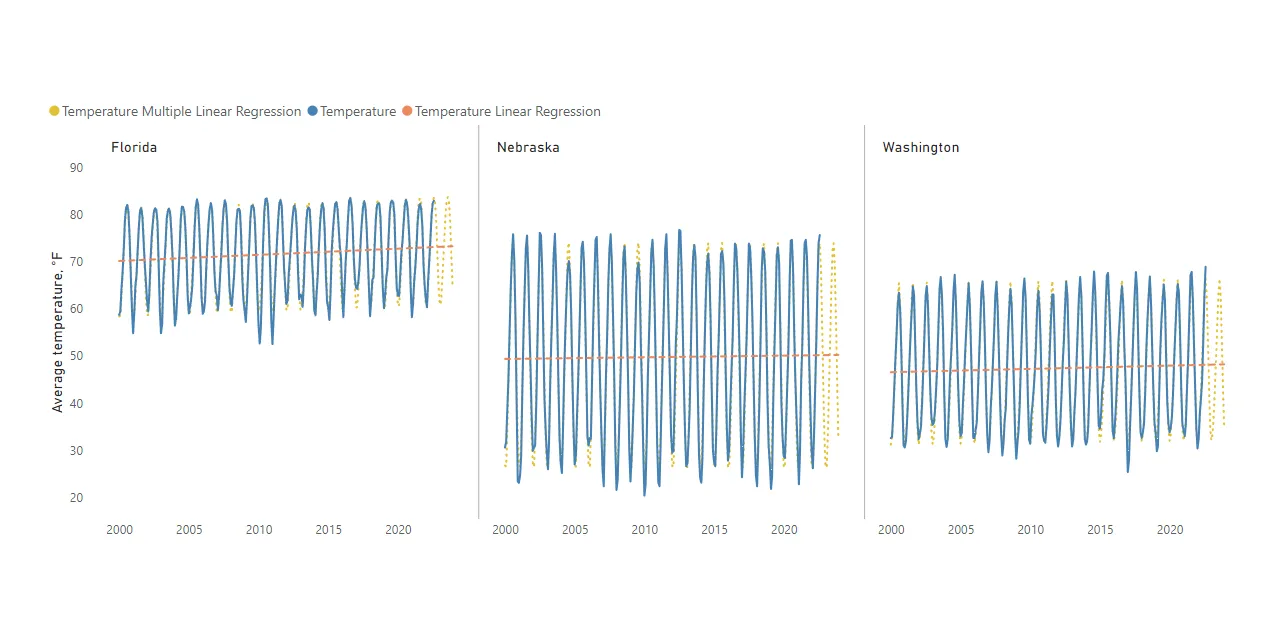
DAX function LINESTX is very useful for time series forecasting in Power BI. You can get forecasting results for multiple time series at the same time. It works similarly to the Excel function LINEST. If you are familiar with that, LINESTX might be easy to understand. LINESTX is useful for creating forecasts using linear or… Continue reading Time series forecasting in Power BI using DAX function LINESTX
Category: Power BI
Jitter chart in Power BI with average line by categories

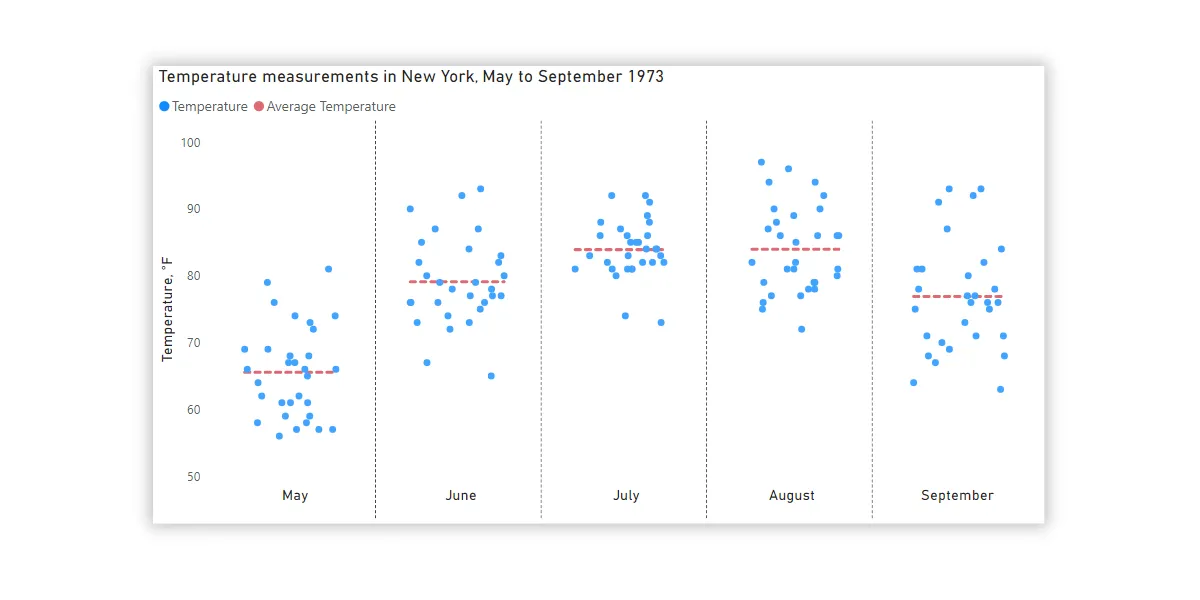
Here is how to create a jitter chart in Power BI with averages by categories and using only Power BI and DAX capabilities. No custom visualizations are necessary. A jitter chart makes it easier to view overlapping data points by categories.
Create star rating in Excel or Power BI using DAX

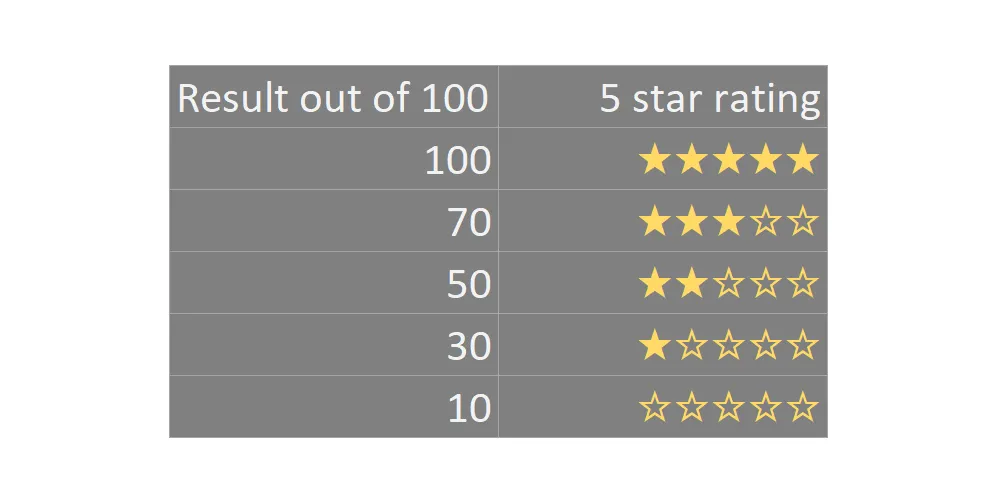
Here is a simple solution to create a five star rating in Excel using formulas or Power BI using DAX. The result is obtainable using only Excel formulas or DAX capabilities. You can do that with other symbols or emojis too. With the same techniques, it is possible to create a progress bar in Excel… Continue reading Create star rating in Excel or Power BI using DAX
Calculate quarter in DAX from date using Power BI or Excel
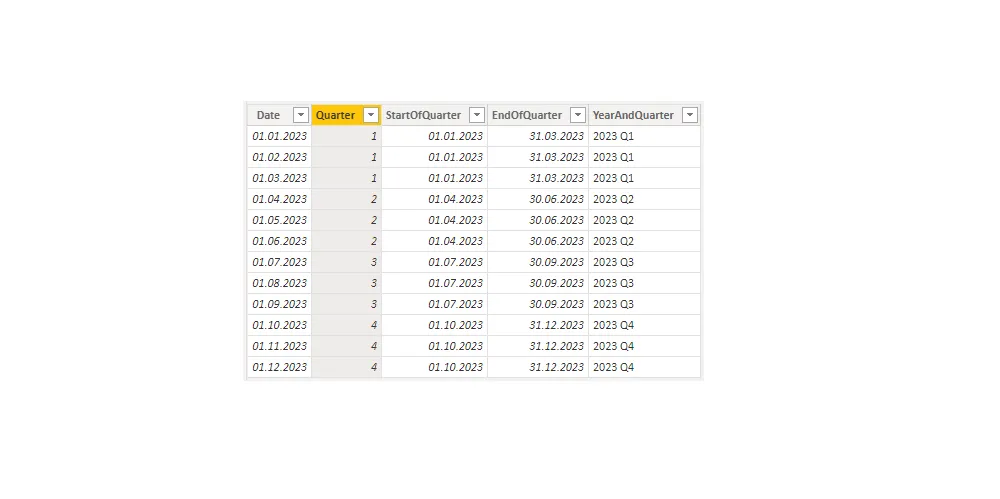
Here is an approach that will help you calculate quarter in DAX from the date using various tools like Power BI or Excel data model. The previous post contains a method that is useful not only in Excel but also using Power BI.
Switch Power BI chart axis dimensions

Here is a solution to add more analytical capabilities to your Power BI charts. Switch Power BI chart axis dimensions to get data grouped by dates, weeks, months, or any other way that you want. By modifying the data model, you can create a slicer that can swap the necessary scale of the axis. That… Continue reading Switch Power BI chart axis dimensions
How to calculate weighted average using DAX in Power BI


Here is how to calculate weighted average using DAX in Power BI. By creating a measure that calculates the weighted average, you can get results by necessary category.
3 ways how to create OR logic in DAX


OR logic in DAX is frequently used in various Power BI calculations. The bad and the good news is that you can create that in multiple ways. In this post is 3 of them, and you can decide which is the best one for you.
Always import all columns from CSV file with Power Query


Here is how to manage that you always import all columns from the CSV file with Power Query. There is no difference in solution if you want to import data from the CSV file into Excel or Power BI by using Power Query. That might be very useful in situations when the CSV file is… Continue reading Always import all columns from CSV file with Power Query
Calculate weighted average in Excel PivotTable in 2 ways

Here are a few methods on how to calculate the weighted average in Excel PivotTable or DAX. It is not so simple as a weighted average by using calculation in an Excel worksheet. The good news is that you can use that method to validate your results.
Data dictionary in Power BI by using Q&A, GIF background


Here is a fun way to use Q&A functionality to build a data dictionary in Power BI. The first question might be – what is a data dictionary? There might be a different understanding, but my definition is similar to this one. A collection of definitions about data that you have and specific terminology.