DAX function LINESTX is very useful for time series forecasting in Power BI. You can get forecasting results for multiple time series at the same time. It works similarly to the Excel function LINEST. If you are familiar with that, LINESTX might be easy to understand. LINESTX is useful for creating forecasts using linear or multiple regression analysis.
While there is forecasting functionality in the Power BI Analytics pane, at this moment, you can not apply that to small multiples, and it is not helpful if you want to get forecasts for multiple time series in the table or use them in additional calculations. Some of the cons might be good reasons to use LINESTX. An additional advantage for the LINESTX is that you can see in Power BI how well the forecasting model describes historical data.
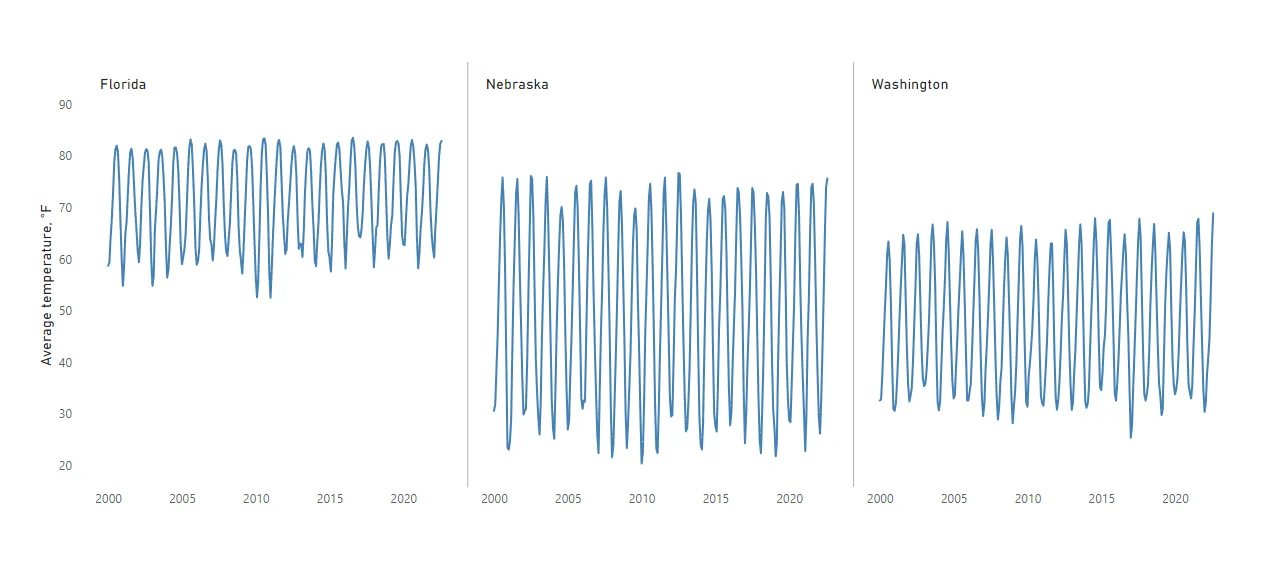
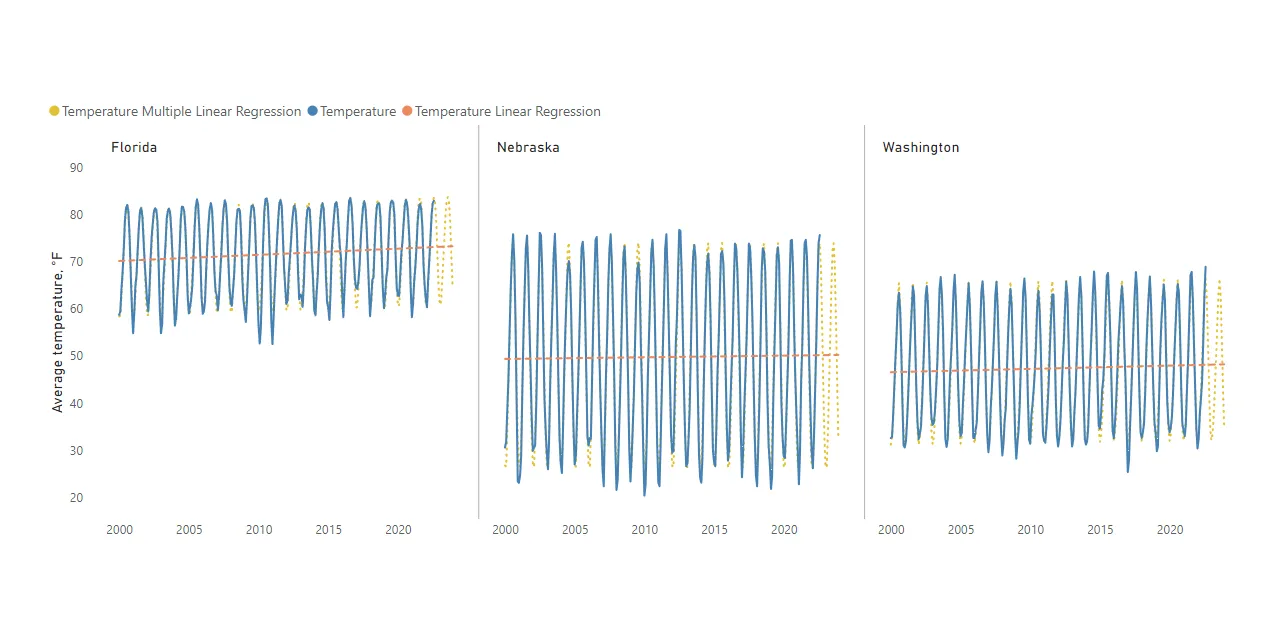
My data set contains 3 time series. Each time series represents average monthly air temperatures from January 2000 to August 2022 for 3 US states, but you can obtain more data here.
First, I will try to get a simple linear trend for each time series by using a small multiples line chart and generate a forecast for the next months in year 2022 and year 2023.
Secondly, I will create a forecast using multiple linear regression using LINESTX. Air temperatures have clearly visible monthly seasonality that is useful to make better predictions for future periods.
The function LINESTX might not be the easiest to understand. I can recommend this post, which also helped me to understand how it works. You can also download my file with the final results.
Linear regression in Power BI using small multiples and LINESTX
My data model contains one table with temperatures and another with first dates for each month of the year.
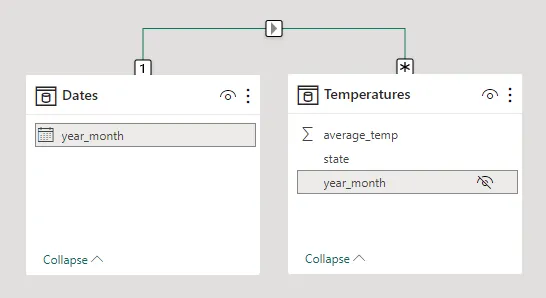
It also includes future dates for the forecasting, and you can obtain that by generating dates with DAX.
Dates =

VAR tempcal = CALENDAR(MIN(Temperatures[year_month]), DATE(2023, 12, 1))

RETURN

SELECTCOLUMNS (
    FILTER(tempcal, DAY([Date]) = 1),
    "year_month", [Date])
Alternatively, you can create a date table with the function CALENDAR and filter out the first dates of the month in another calculated table.
The next step is to create a measure that calculates regression coefficients for the part of data that contains only actual values. Before that, it is necessary to have a measure for the variable that you want to forecast. This measure should work with different dimensions. For the air temperatures, the average works well, but in other situations, it might be the sum or other calculation.
Temperature = AVERAGE(Temperatures[average_temp])
You can get the measure for necessary dates to calculate regression coefficients with LINESTX.
Temperature Linear Regression =

VAR data =
    FILTER (
        SELECTCOLUMNS (
            ALLSELECTED ( Dates[year_month] ),
            "YM", [year_month],
            "Temp", [Temperature]
        ),
        NOT ( ISBLANK ( [Temperature] ) )
    )
VAR coef =
    LINESTX ( data, [Temp], [YM] )
VAR slope =
    SELECTCOLUMNS ( coef, [Slope1] )
VAR intercept =
    SELECTCOLUMNS ( coef, [Intercept] )

RETURN
    SELECTEDVALUE ( Dates[year_month] ) * slope + intercept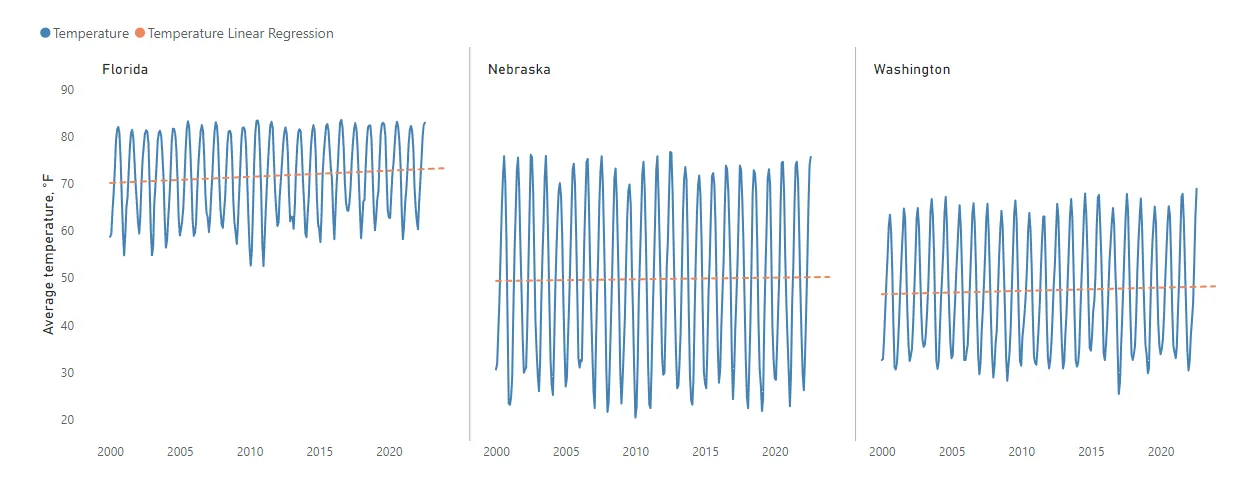
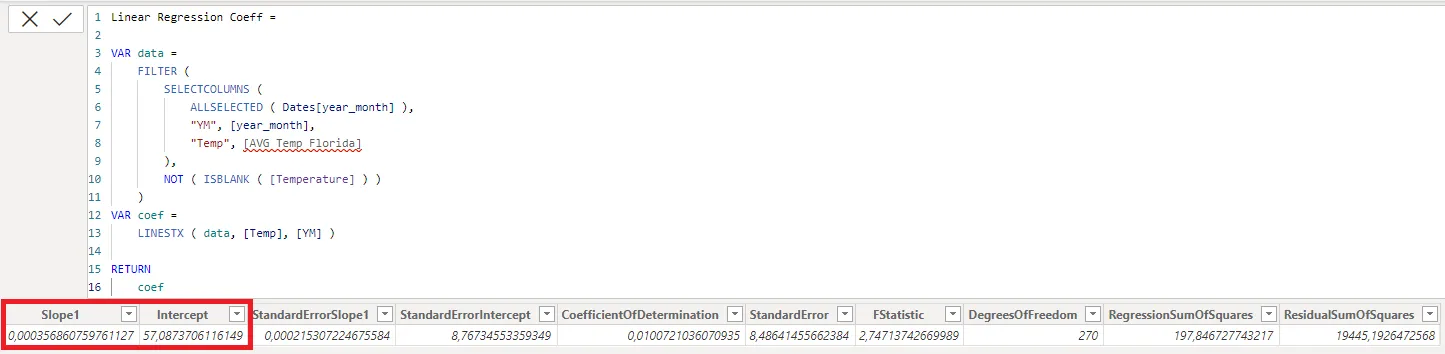
If you want to understand the results of the LINESTX, try to display them in the calculated table. You can compare it with the results of the equation of the Excel trendline.
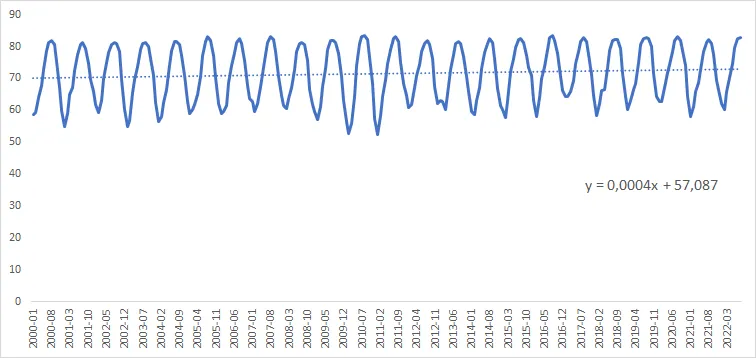
Here is how it looks for the Florida time series.
AVG Temp Florida =
AVERAGEX (
    FILTER ( Temperatures, Temperatures[state] = "Florida" ),
    Temperatures[average_temp]
)
Multiple time series forecasting in Power BI using multiple regression and LINESTX
If there is seasonality, like in this case, you can use that to create better forecasts. You can describe monthly seasonality with additional columns in the date table like this.
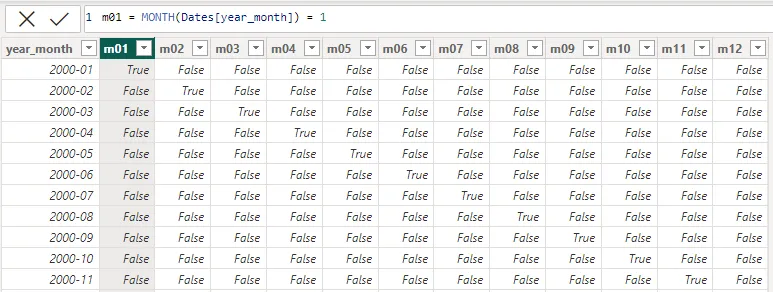
You can convert TRUE and FALSE into 1 and 0 in Power BI like in this post, but it doesn’t matter for the calculations.
If you want to take into account seasonality for the time series forecasting in Power BI, it makes the measure a lot longer, but it might be worth it.
Temperature Multiple Linear Regression =

VAR data =
    FILTER (
        SELECTCOLUMNS (
            ALLSELECTED ( Dates[year_month] ),
            "YM", [year_month],
            "Temp", [Temperature]
        ),
        NOT ( ISBLANK ( [Temperature] ) )
    )

VAR coef = LINESTX(data
, [Temp]
, [YM]
, MONTH([YM]) = 1
, MONTH([YM]) = 2
, MONTH([YM]) = 3
, MONTH([YM]) = 4
, MONTH([YM]) = 5
, MONTH([YM]) = 6
, MONTH([YM]) = 7
, MONTH([YM]) = 8
, MONTH([YM]) = 9
, MONTH([YM]) = 10
, MONTH([YM]) = 11
, MONTH([YM]) = 12)

VAR slope = SELECTCOLUMNS(coef, [Slope1])
VAR m01 = SELECTCOLUMNS(coef, [Slope2])
VAR m02 = SELECTCOLUMNS(coef, [Slope3])
VAR m03 = SELECTCOLUMNS(coef, [Slope4])
VAR m04 = SELECTCOLUMNS(coef, [Slope5])
VAR m05 = SELECTCOLUMNS(coef, [Slope6])
VAR m06 = SELECTCOLUMNS(coef, [Slope7])
VAR m07 = SELECTCOLUMNS(coef, [Slope8])
VAR m08 = SELECTCOLUMNS(coef, [Slope9])
VAR m09 = SELECTCOLUMNS(coef, [Slope10])
VAR m10 = SELECTCOLUMNS(coef, [Slope11])
VAR m11 = SELECTCOLUMNS(coef, [Slope12])
VAR m12 = SELECTCOLUMNS(coef, [Slope13])
VAR intercept = SELECTCOLUMNS(coef, [Intercept])

RETURN
SELECTEDVALUE(Dates[year_month]) * slope
+ SELECTEDVALUE(Dates[m01]) * m01
+ SELECTEDVALUE(Dates[m02]) * m02
+ SELECTEDVALUE(Dates[m03]) * m03
+ SELECTEDVALUE(Dates[m04]) * m04
+ SELECTEDVALUE(Dates[m05]) * m05
+ SELECTEDVALUE(Dates[m06]) * m06
+ SELECTEDVALUE(Dates[m07]) * m07
+ SELECTEDVALUE(Dates[m08]) * m08
+ SELECTEDVALUE(Dates[m09]) * m09
+ SELECTEDVALUE(Dates[m10]) * m10
+ SELECTEDVALUE(Dates[m11]) * m11
+ SELECTEDVALUE(Dates[m12]) * m12
+ intercept
You can also display facts and forecasts in Power BI matrix visualization like this.
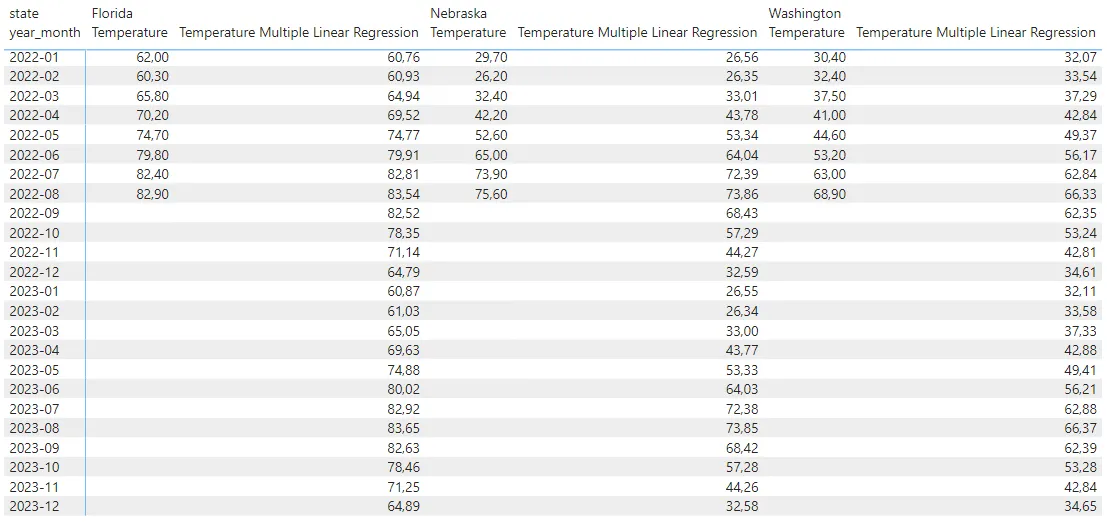
Download the pbix file with all the examples.
Leave a Reply