
Here is how to calculate weighted average using DAX in Power BI. By creating a measure that calculates the weighted average, you can get results by necessary category.
Below is a detailed explanation with an example, but you can also go further with this weighted average calculation using DAX.
Weighted Average =
DIVIDE (
SUMX ( MyTable, MyTable[ColumnWithWeights] * MyTable[ColumnForAverage] ),
SUM ( MyTable[ColumnWithWeights] )
)
It is important to use the DIVIDE function if there is a division with zero.
Preparation of an example
In this example will be a calculation in Power BI of weighted MAPE. MAPE is a calculation of mean absolute percentage error that is used to evaluate forecasting precision.
Here is an M code that you can put in a blank query and get a column with weekdays, forecasts, and facts. Absolute percentage calculation is in Power Query.
let
    Source = Table.FromRows(Json.Document(Binary.Decompress(Binary.FromText("i45W8s3PS0msVNJRMjQwMABRQFopVidaKaQ0tRgqYwSRMTCFyISnpuTB5YzBchYwTRmlRVAZS6gmqIxbUSZE3AwsbgoVDk4sKS2CSFiAxM2hwqVQVxmAcWwsAA==", BinaryEncoding.Base64), Compression.Deflate)), let _t = ((type nullable text) meta [Serialized.Text = true]) in type table [WeekDay = _t, Forecast = _t, Fact = _t]),
    #"Changed Type" = Table.TransformColumnTypes(Source,{{"WeekDay", type text}, {"Forecast", Int64.Type}, {"Fact", Int64.Type}}),
    #"APE calculation" = Table.AddColumn(#"Changed Type", "APE", each if [Fact] = 0 then null else Number.Abs(([Fact] - [Forecast]) / [Fact])),
    #"Changed Type1" = Table.TransformColumnTypes(#"APE calculation",{{"APE", Percentage.Type}})
in
    #"Changed Type1"
As a result, you will get this table that I called Results.
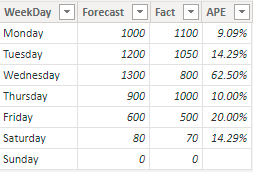
The purpose of the weighted average is to give more weight to the results that involve greater values. In some situations, simple MAPE might not be objective.
Calculate weighted average using DAX in Power BI
A calculation of weighted average using DAX is the same as what I used in Excel PivotTable. Excel contains Power Pivot with similar capabilities using DAX. Create a new measure in Power BI and use this principle.
Weighted MAPE =
DIVIDE(
SUMX(Results, Results[Fact] * Results[APE]),
SUM(Results[Fact])
)
SUMX calculates a sum of multiplication between a column that contains weight and a column that usually contains percentages or averages that have to use this weight. After that comes division with the sum of weights.
Look at this post with examples on how to manage multiple DAX measures in Power BI.
In addition, here is how to calculate the weighted average in an Excel spreadsheet.
Leave a Reply