
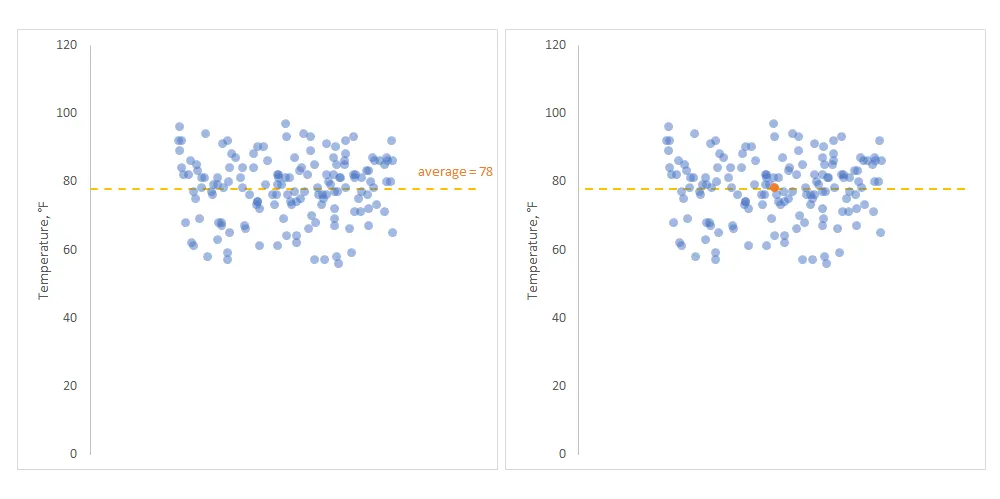
A jitter chart in Excel is a beautiful way to use a scatterplot and randomly distribute data points to make them more visible. In other words, if your problem is overlapping data points in Excel, this might be a good solution.
R programming, Excel, DAX, Power BI
A jitter chart in Excel is a beautiful way to use a scatterplot and randomly distribute data points to make them more visible. In other words, if your problem is overlapping data points in Excel, this might be a good solution.