Tag: jitter graph in Excel
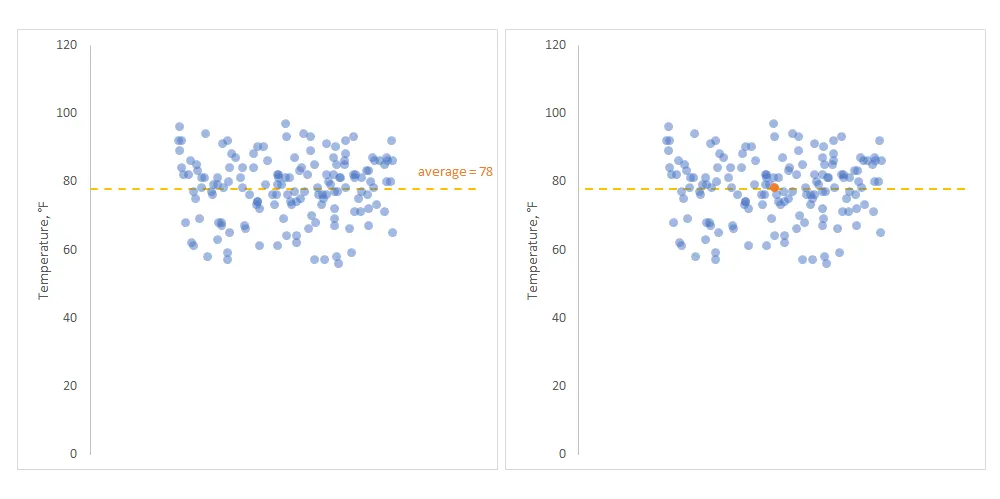
Jitter chart in Excel with average line
A jitter chart in Excel is a beautiful way to use a scatterplot and randomly distribute data points to make them more visible. In other words, if your problem is overlapping data points in Excel, this might be a good solution.
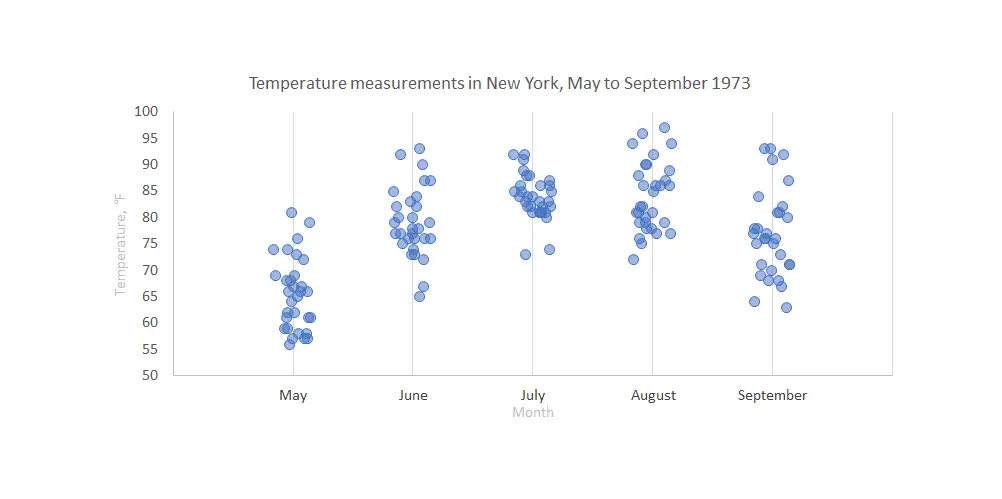
Stripchart in Excel, onedimensional scatter chart with or without jitter
Stripchart in Excel is a great way to compare data points between multiple categories. It might be with or without additional jitter. Jitter in Excel chart helps to see overlapping data points more clearly. Here is how to create one step by step.