

Very often I use RStudio and Excel all together. In that situation, sometimes I want to copy some R results in the Excel spreadsheet, and, depending on the amount of data that I want to copy, there are different solutions to that process.
How to quickly open Windows command prompt

1. Press Win + R keys to launch Run window and type “cmd”. 2. If you are Windows 10 user, then press Win + X to open Quick Link menu and press C. 3. If you are the RStudio user, then switch to Terminal in your Console pane.
How to run R scripts from the Windows command line (CMD)


R is excellent for data transformation, modeling, etc. automatization. It is possible to run R scripts from the command line. In my case, I was collecting data and using library RDCOMClient to send summary information to colleges with Microsoft Outlook, but I needed it to do that automatically. It is possible to run R scripts… Continue reading How to run R scripts from the Windows command line (CMD)
How to fix it: Excel 2016 restarting immediately after opening xlsm file


This kind of problem when Excel crashes do not happen very often, but with no recovery options it can make you feel frustrated. Here is the solution that helped me and I hope you too.
How to get LiveChat API data with Microsoft Excel or Power BI


Here is an example with getting LiveChat transcripts right into Microsoft Excel Power Query or Power BI. Chat conversations are not the most convenient data what you can get through the API, because results are divided into pages, each containing 25 chats. So in the further post is a simple method of how to make… Continue reading How to get LiveChat API data with Microsoft Excel or Power BI
How much you can do with PivotTable in 5 minutes?

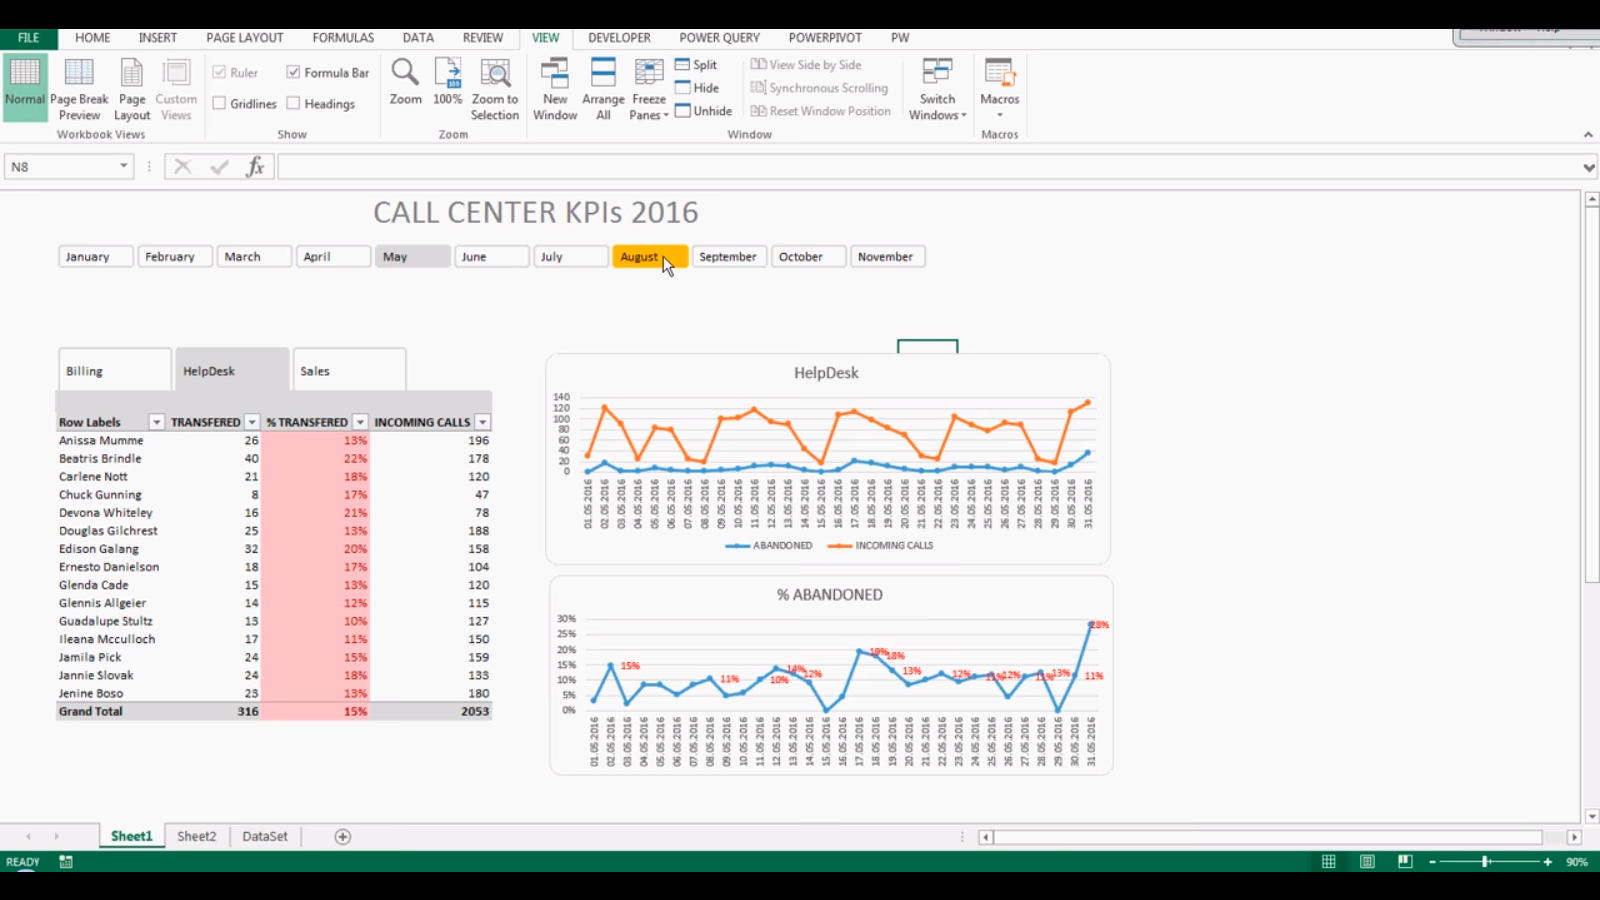
A few years ago I was participating in an Excel PivotTable contest, where the goal was to make the best PivotTable you can under 5 minutes. I don’t know how good was mine, but in this video is a bunch of interesting stuff going on. My goal was to do as much as I can,… Continue reading How much you can do with PivotTable in 5 minutes?
How to generate date and time interval list using Power Query


One thing I love about Microsft Power Query is the ability to make lists. It means that you can generate data without some additional source. I will show you how to make list with the last seven days and 15 minute time intervals. It is useful when you combine it with data, where several periods… Continue reading How to generate date and time interval list using Power Query
How to copy a sharp picture from Excel without blurry effect

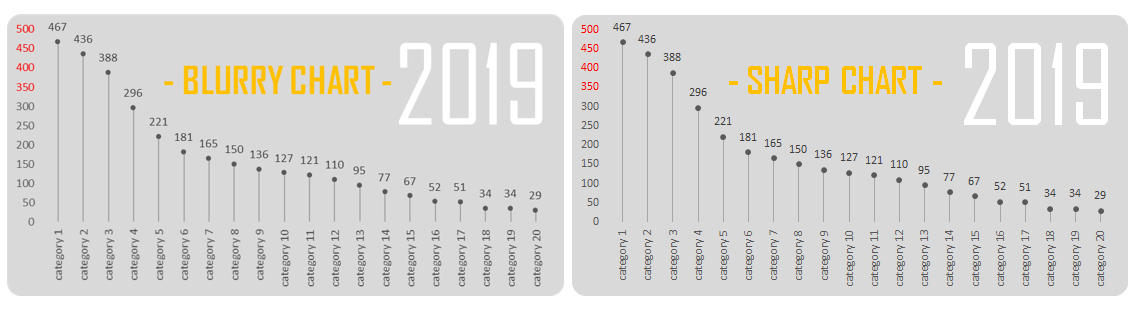
Imagine – you copy beautiful chart as a picture from Excel to Outlook message and it becomes blurry. The same thing with PowerPoint – sometimes you want some static chart or table image, but picture quality becomes a real problem. As you see in post title image, I have a solution and it’s pretty simple.
Probably simplest and fastest way how to make a histogram in Excel


Histograms are useful for data distribution visualization, and there are many possible ways how to make an Excel PivotTable histogram. Some may prefer the Histogram option in Data Analysis Add-In or the FREQUENCY function for this task. But I think that the easiest way is to do that with PivotTable. Here is how to do… Continue reading Probably simplest and fastest way how to make a histogram in Excel
2 tips how to change Windows CMD looks

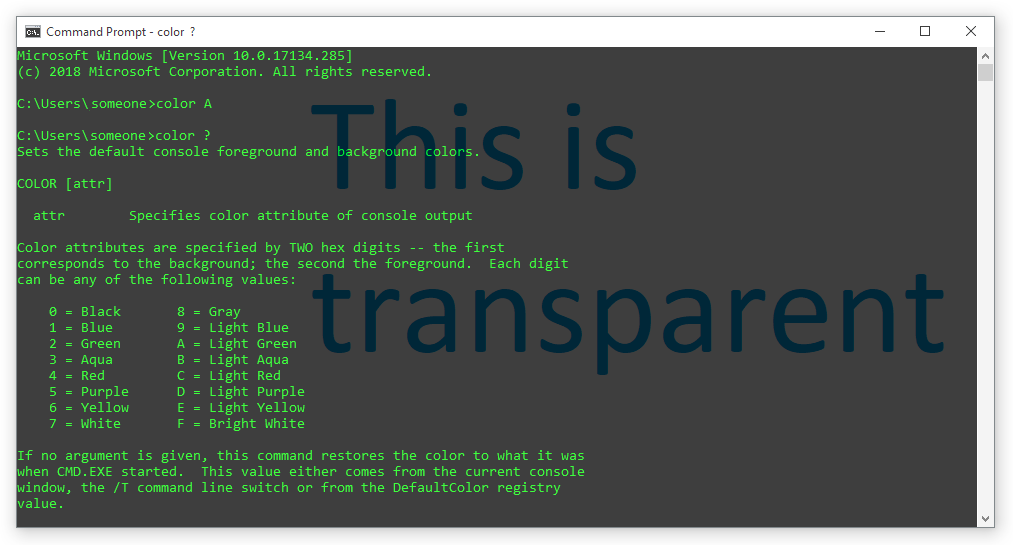
The first tip is a feature that is new to Windows 10. When you right-click on command prompt title bar and go to properties, in colors tab is opacity option. There you can adjust some transparency settings to get an interesting touch to the good old command line.