If you want to keep trailing zeros in R, and in particular for text labels in ggplot2 geom_text, try functions like sprintf, formatC, or digits from the formattable package. Add trailing zeros in the R data frame, ggplot2, and keep numerical properties using the function digits from the formattable.
Here is the data set containing United States personal expenditures (in billions of dollars) for a few years. Data about expenditures contain more decimal places than in need.
library(reshape2)

ue <- melt(USPersonalExpenditure)
ue <- setNames(ue, c("categories", "year", "expenditures"))

head(ue)

#           categories years expenditures
# 1    Food and Tobacco  1940       22.200
# 2 Household Operation  1940       10.500
# 3  Medical and Health  1940        3.530
# 4       Personal Care  1940        1.040
# 5   Private Education  1940        0.341
# 6    Food and Tobacco  1945       44.500
By using ggplot2, I created a simple table. As you can see, the numbers that I obtained with geom_text have differences in decimal places. I would like to have two everywhere and add trailing zeros where necessary.
require(ggplot2)

ggplot(ue, aes(x = year, y = categories)) +
  geom_tile(colour = "gray", linewidth = 0.25, fill = "white") +
  geom_text(aes(label = expenditures)
            , color = "cadetblue", size = 4.5, fontface = "bold") +
  scale_x_continuous(expand = c(0,0), position = "top") +
  scale_y_discrete(expand = c(0,0)) +
  theme(axis.title = element_blank()
        , text = element_text(size = 15)
        , axis.ticks = element_blank()
        , axis.text.y = element_text(hjust = 0))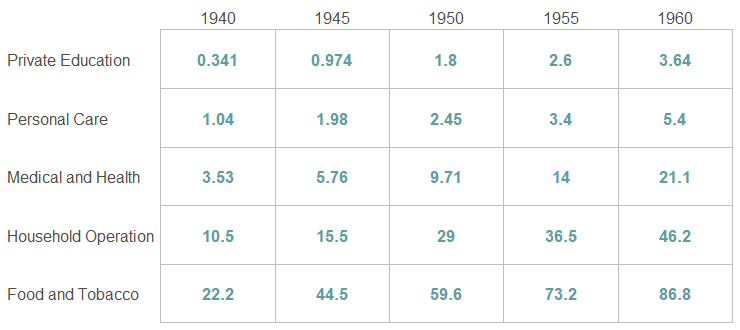
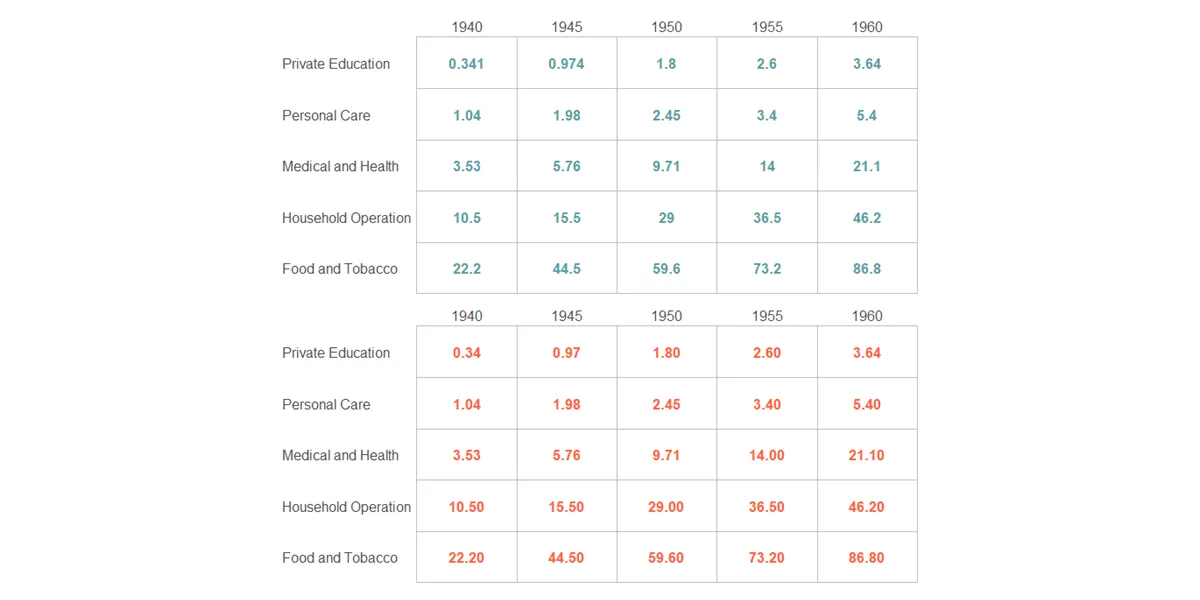
My first idea was to round numbers and keep only two decimal places.
ue$expenditures <- round(ue$expenditures, digits = 2)

head(ue)

#           categories year expenditures
# 1    Food and Tobacco 1940        22.20
# 2 Household Operation 1940        10.50
# 3  Medical and Health 1940         3.53
# 4       Personal Care 1940         1.04
# 5   Private Education 1940         0.34
# 6    Food and Tobacco 1945        44.50
Unfortunately, in the results, you can see that those who had three decimal places now have two, but those who had one, have only one. There are no trailing zeros where necessary.
ggplot(ue, aes(x = year, y = categories)) +
  geom_tile(colour = "gray", linewidth = 0.25, fill = "white") +
  geom_text(aes(label = expenditures)
            , color = "cadetblue", size = 4.5, fontface = "bold") +
  scale_x_continuous(expand = c(0,0), position = "top") +
  scale_y_discrete(expand = c(0,0)) +
  theme(axis.title = element_blank()
        , text = element_text(size = 15)
        , axis.ticks = element_blank()
        , axis.text.y = element_text(hjust = 0))
Keep trailing zeros in R ggplot2 geom_text
You can keep trailing zeros in R similarly to adding leading zeros.
Try functions like sprintf or formatC. The result of both functions has character formatting.
class(sprintf("%.2f", ue$expenditures))

#[1] "character"
If you want to get trailing zeros in ggplot2 and keep numerical properties, try the function digits from the formattable.
class(formattable::digits(ue$expenditures, digits = 2))

#[1] "formattable" "numeric"

mean(sprintf("%.2f", ue$expenditures))

#[1] NA

mean(formattable::digits(ue$expenditures, digits = 2))

#[1] 20.07
With the function digits, I can overwrite necessary data frame content and keep it shorter with ggpplot2. You can also use that inside geom_text to get trailing zeros where that is necessary.
ggplot(ue, aes(x = year, y = categories)) +
  geom_tile(colour = "gray", linewidth = 0.25, fill = "white") +
  geom_text(aes(label = formattable::digits(expenditures, digits = 2))
            , color = "cadetblue", size = 4.5, fontface = "bold") +
  scale_x_continuous(expand = c(0,0), position = "top") +
  scale_y_discrete(expand = c(0,0)) +
  theme(axis.title = element_blank()
        , text = element_text(size = 15)
        , axis.ticks = element_blank()
        , axis.text.y = element_text(hjust = 0))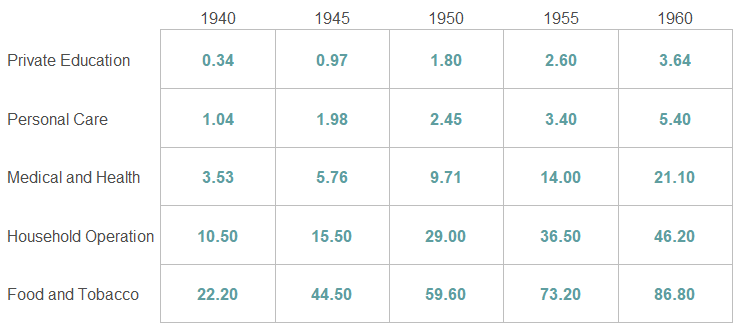
Here is how to get trailing zeros with the sprintf and visualize text labels with two decimal places and trailing zeros.
ggplot(ue, aes(x = year, y = categories)) +
  geom_tile(colour = "gray", linewidth = 0.25, fill = "white") +
  geom_text(aes(label = sprintf("%.2f", expenditures))
            , color = "cadetblue", size = 4.5, fontface = "bold") +
  scale_x_continuous(expand = c(0,0), position = "top") +
  scale_y_discrete(expand = c(0,0)) +
  theme(axis.title = element_blank()
        , text = element_text(size = 15)
        , axis.ticks = element_blank()
        , axis.text.y = element_text(hjust = 0))
Here is how to get the same result with the formatC.
ggplot(ue, aes(x = year, y = categories)) +
  geom_tile(colour = "gray", linewidth = 0.25, fill = "white") +
  geom_text(aes(label = formatC(expenditures, format = 'f', digits = 2))
            , color = "cadetblue", size = 4.5, fontface = "bold") +
  scale_x_continuous(expand = c(0,0), position = "top") +
  scale_y_discrete(expand = c(0,0)) +
  theme(axis.title = element_blank()
        , text = element_text(size = 15)
        , axis.ticks = element_blank()
        , axis.text.y = element_text(hjust = 0))
The same principle applies to other ggplot2 visualizations where you want to add data labels. Keep a certain amount of decimal places and add trailing zeros where necessary.
Here is how it looks with the bar chart from the previous post about functions sub and gsub.
require(dplyr)

ue$expenditures <- formattable::digits(ue$expenditures, digits = 2)

ue %>%
  filter(year == 1960) %>%
  ggplot(aes(x = expenditures, y = reorder(categories, expenditures))) +
  geom_col(fill = "steelblue") +
  geom_text(aes(label = expenditures), hjust = -0.5) +
  xlim(0, 100) +
  theme_minimal() +
  theme(axis.title = element_blank()
        , axis.text.y = element_text(hjust = 0)
        , text = element_text(size = 15))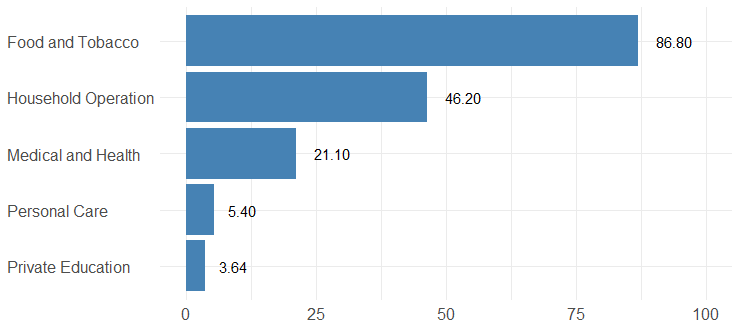
Leave a Reply