
Here is how to find and replace the first occurrence of a character or string in R. It will help you to separate words in multiple lines in ggplot2 visualizations or do other tasks.
Replace first in R
It is easy to replace the first occurrence of a character if you know the difference between functions sub and gsub.
If I want to swap the first whitespace with other content, then the function sub works perfectly.
sub(" ", ": ", "Subject My latest posts.")

#[1] "Subject: My latest posts."
In the same situation, gsub makes replacements for all the matches of the whitespace.
gsub(" ", ": ", "Subject My latest posts.")

#[1] "Subject: My: latest: posts."
The function gsub is useful to remove unwanted characters in R, like in this post. If you want to do replacements in the whole data frame, look at this post.
Show strings in multiple lines ggplot2 by replacing whitespace
Here is how to replace the first whitespace to split words into separate lines on the ggplot2 axis.
The data set contains United States personal expenditures (in billions of dollars) for a few years.
USPersonalExpenditure

#                      1940   1945  1950 1955  1960
# Food and Tobacco    22.200 44.500 59.60 73.2 86.80
# Household Operation 10.500 15.500 29.00 36.5 46.20
# Medical and Health   3.530  5.760  9.71 14.0 21.10
# Personal Care        1.040  1.980  2.45  3.4  5.40
# Private Education    0.341  0.974  1.80  2.6  3.64
I want to show this information about the year 1960. I’m getting this data from a matrix to a long-format R data frame with additional transformations.
library(reshape2)

ue <- melt(USPersonalExpenditure)
ue <- setNames(ue, c("categories", "year", "expenditures"))

head(ue)

#           categories years expenditures
# 1    Food and Tobacco  1940       22.200
# 2 Household Operation  1940       10.500
# 3  Medical and Health  1940        3.530
# 4       Personal Care  1940        1.040
# 5   Private Education  1940        0.341
# 6    Food and Tobacco  1945       44.500
Here is the first visualization. Each axis tick labels are in one line.
require(ggplot2)
require(dplyr)

ue %>%
  filter(year == 1960) %>%
  ggplot(aes(x = expenditures, y = reorder(categories, expenditures))) +
  geom_col(fill = "steelblue") +
  theme_minimal() +
  theme(axis.title = element_blank()
        , axis.text.y = element_text(hjust = 0)
        , text = element_text(size = 15))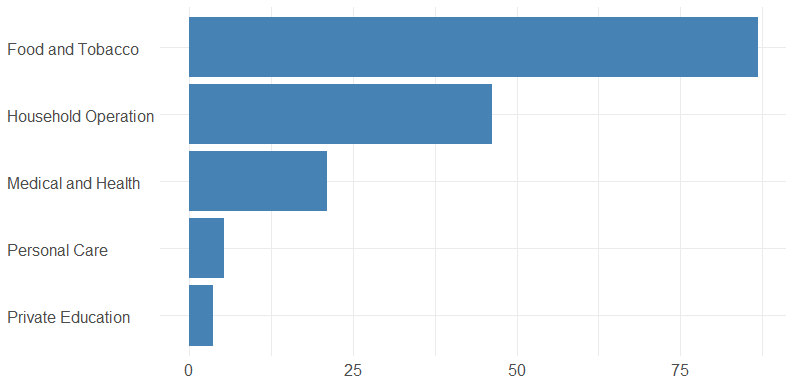
It might be a good idea to use a new line character instead of the first whitespace character and align tick labels to the left side. That will help you to optimize the necessary space for the tick labels on the vertical axis.
ue$categories <- sub(" ", "\n", ue$categories)

ue %>%
  filter(year == 1960) %>%
  ggplot(aes(x = expenditures, y = reorder(categories, expenditures))) +
  geom_col(fill = "steelblue") +
  theme_minimal()+
  theme(axis.title = element_blank()
        , axis.text.y = element_text(hjust = 0)
        , text = element_text(size = 15))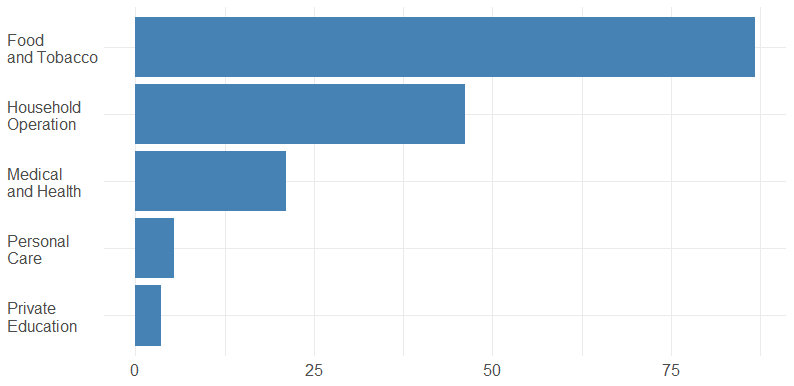
If you want to get more ideas about data visualizations in R, look at these posts from this blog.
Leave a Reply