Category: DAX
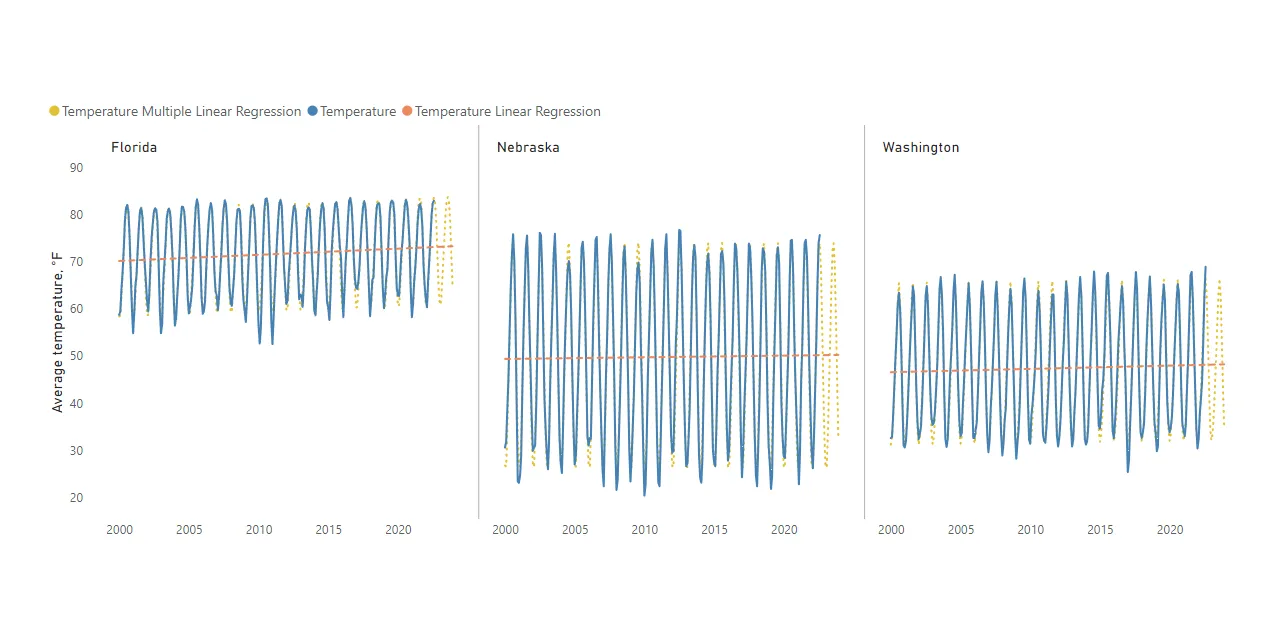
Time series forecasting in Power BI using DAX function LINESTX
DAX function LINESTX is very useful for time series forecasting in Power BI. You can get forecasting results for multiple time series at the same time. It works similarly to the Excel function LINEST. If you are familiar with that, LINESTX might be easy to understand. LINESTX is useful for creating forecasts using linear or…
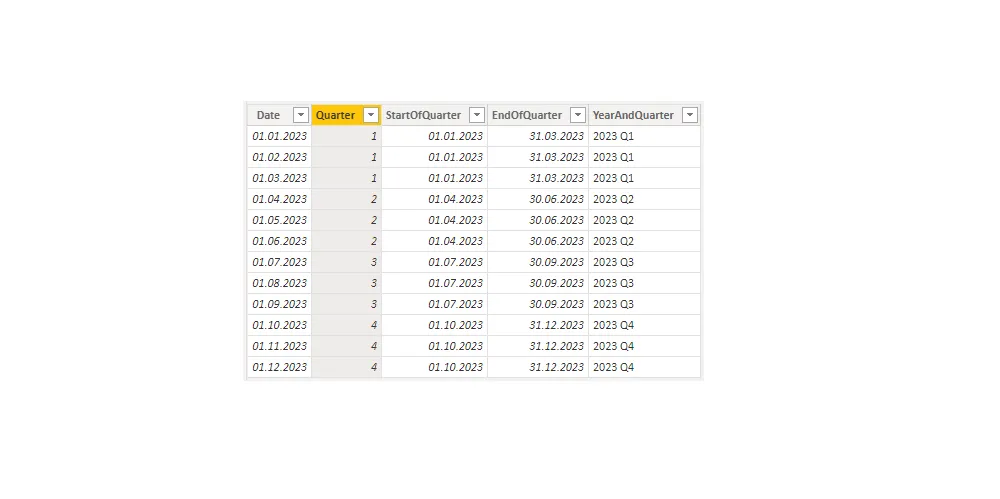
Calculate quarter in DAX from date using Power BI or Excel
Here is an approach that will help you calculate quarter in DAX from the date using various tools like Power BI or Excel data model. The previous post contains a method that is useful not only in Excel but also using Power BI.
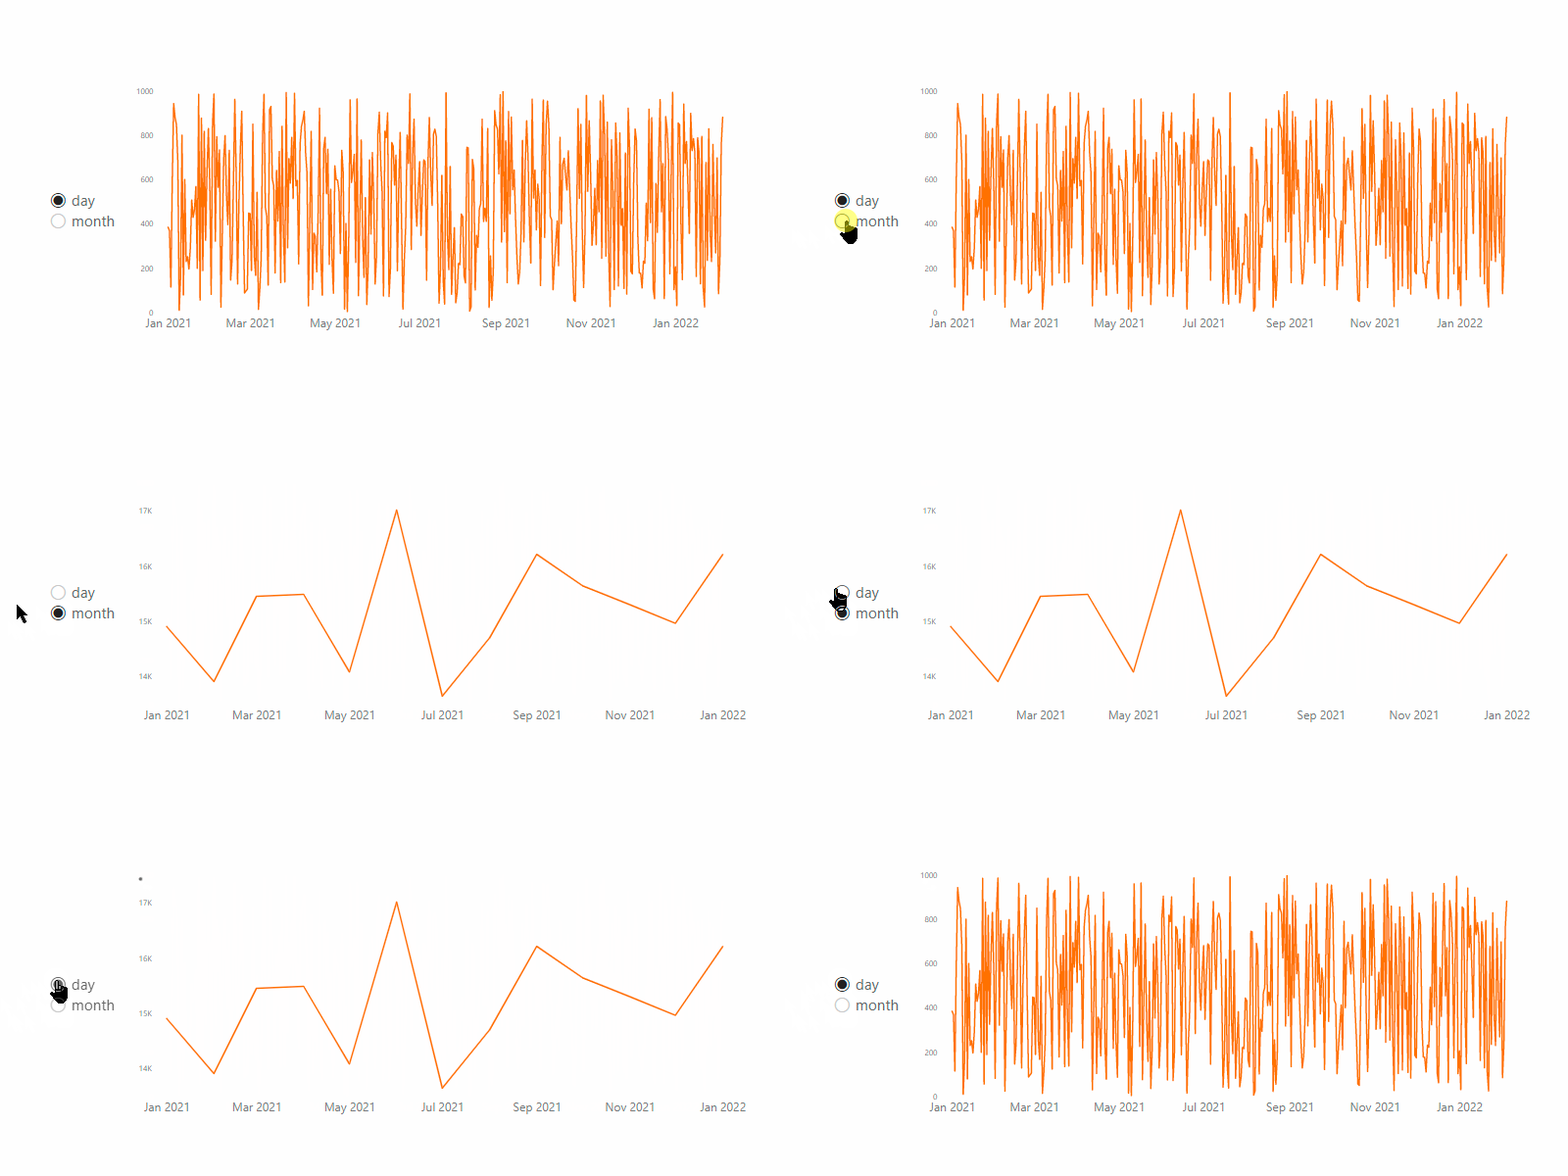
Switch Power BI chart axis dimensions
Here is a solution to add more analytical capabilities to your Power BI charts. Switch Power BI chart axis dimensions to get data grouped by dates, weeks, months, or any other way that you want. By modifying the data model, you can create a slicer that can swap the necessary scale of the axis. That…

How to calculate weighted average using DAX in Power BI
Here is how to calculate weighted average using DAX in Power BI. By creating a measure that calculates the weighted average, you can get results by necessary category.

3 ways how to create OR logic in DAX
OR logic in DAX is frequently used in various Power BI calculations. The bad and the good news is that you can create that in multiple ways. In this post is 3 of them, and you can decide which is the best one for you.

Calculate weighted average in Excel PivotTable in 2 ways
Here are a few methods on how to calculate the weighted average in Excel PivotTable or DAX. It is not so simple as a weighted average by using calculation in an Excel worksheet. The good news is that you can use that method to validate your results.
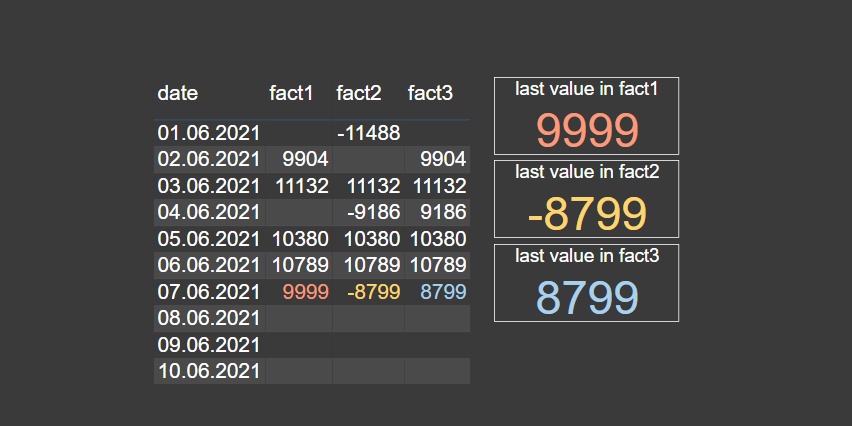
Last available column value in Power BI
Here is how to detect the last available column value in Power BI in almost any situation. The main problem is columns with missing values in one or multiple places. But if your data contains something that represents a sequence, for example, date or index column, there is a simple solution.
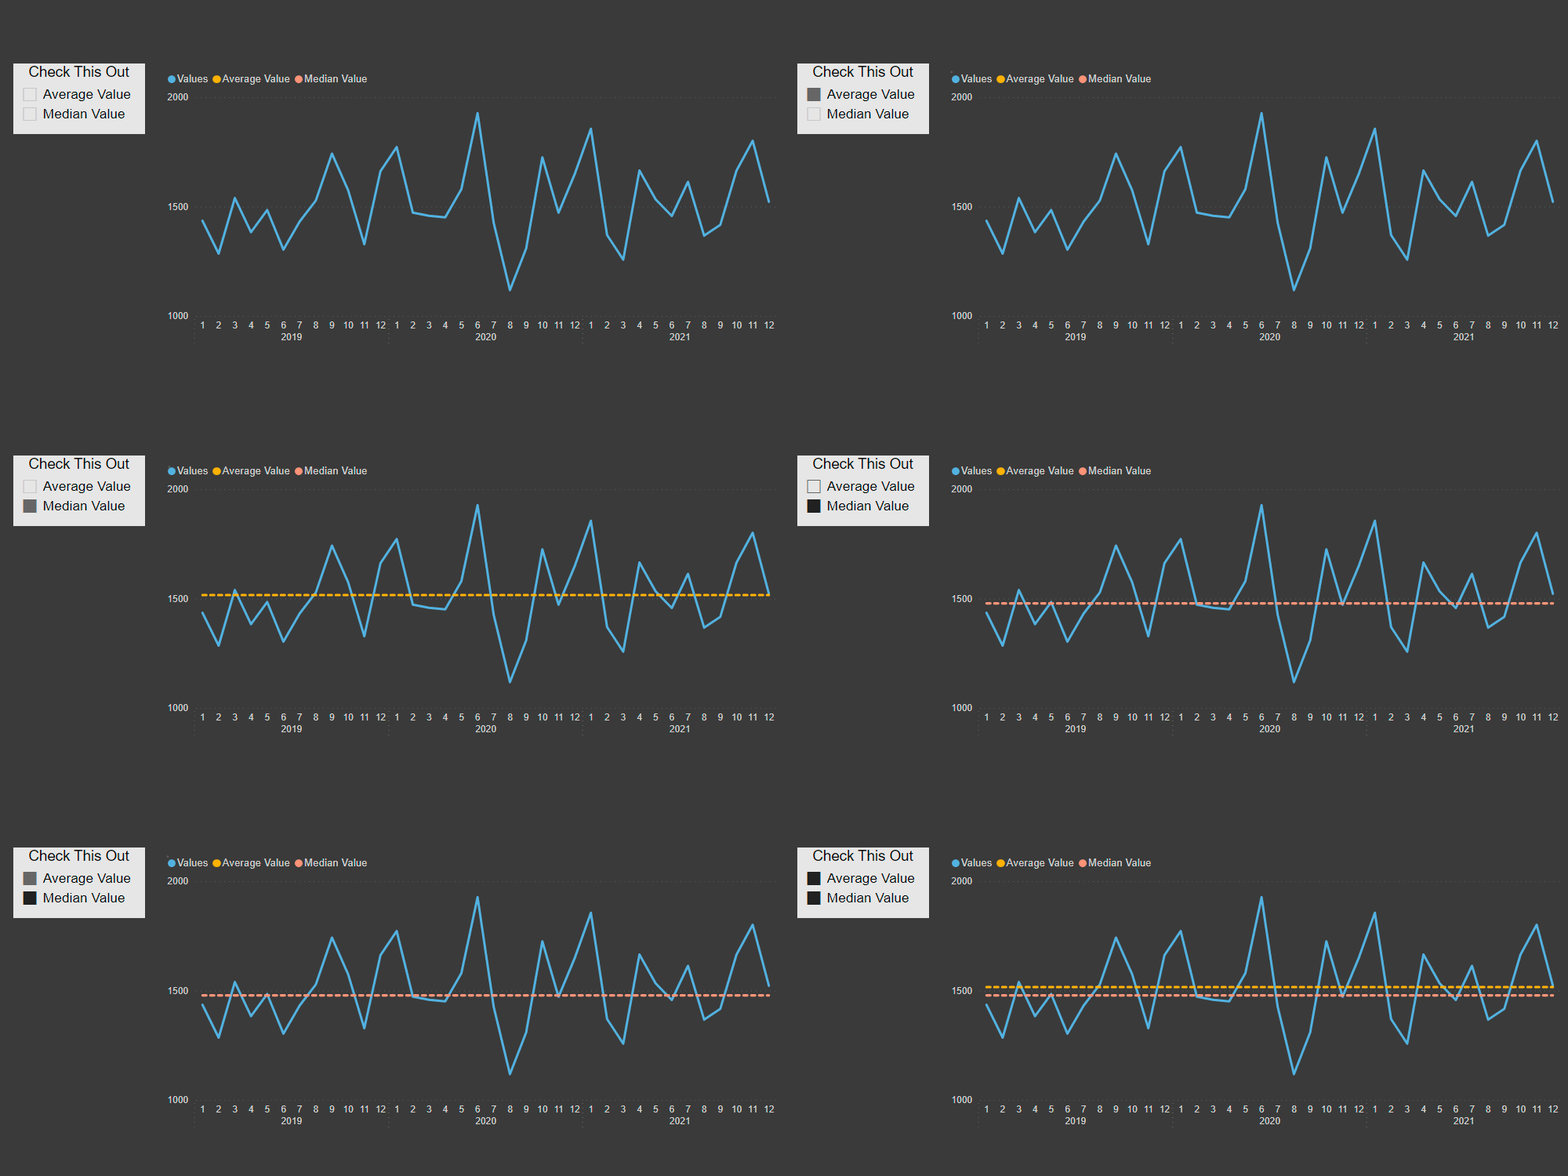
Control Power BI DAX measures with a slicer
It is easy to control Power BI DAX measures with a slicer and turn them on or off for visualizations or other purposes. Here is how to do that in 4 easy steps.
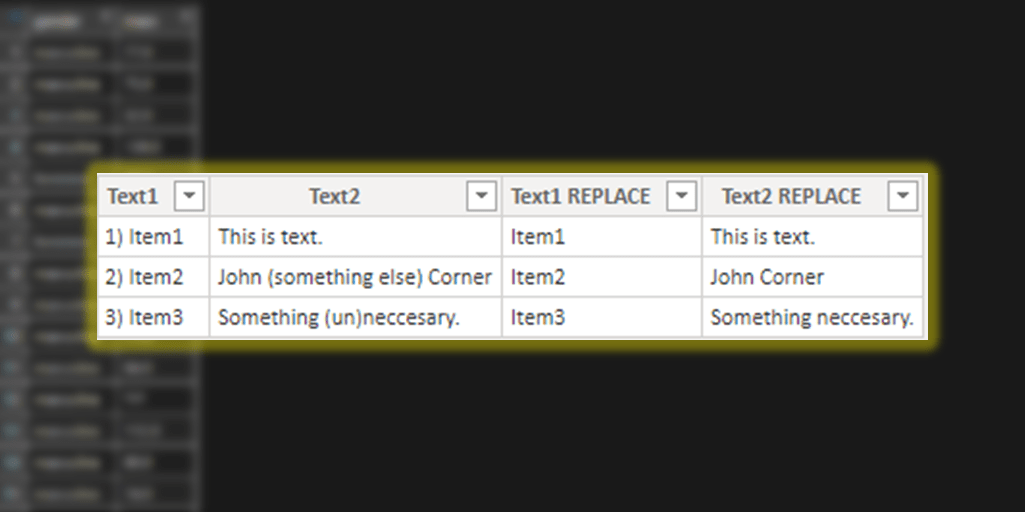
Substitute multiple values by using DAX in Power BI
Sometimes it is necessary to replace multiple values at once using DAX, and the first thing that might come to mind is function SUBSTITUTE. Maybe because of Excel background but in that case, the solution is not straightforward.
