
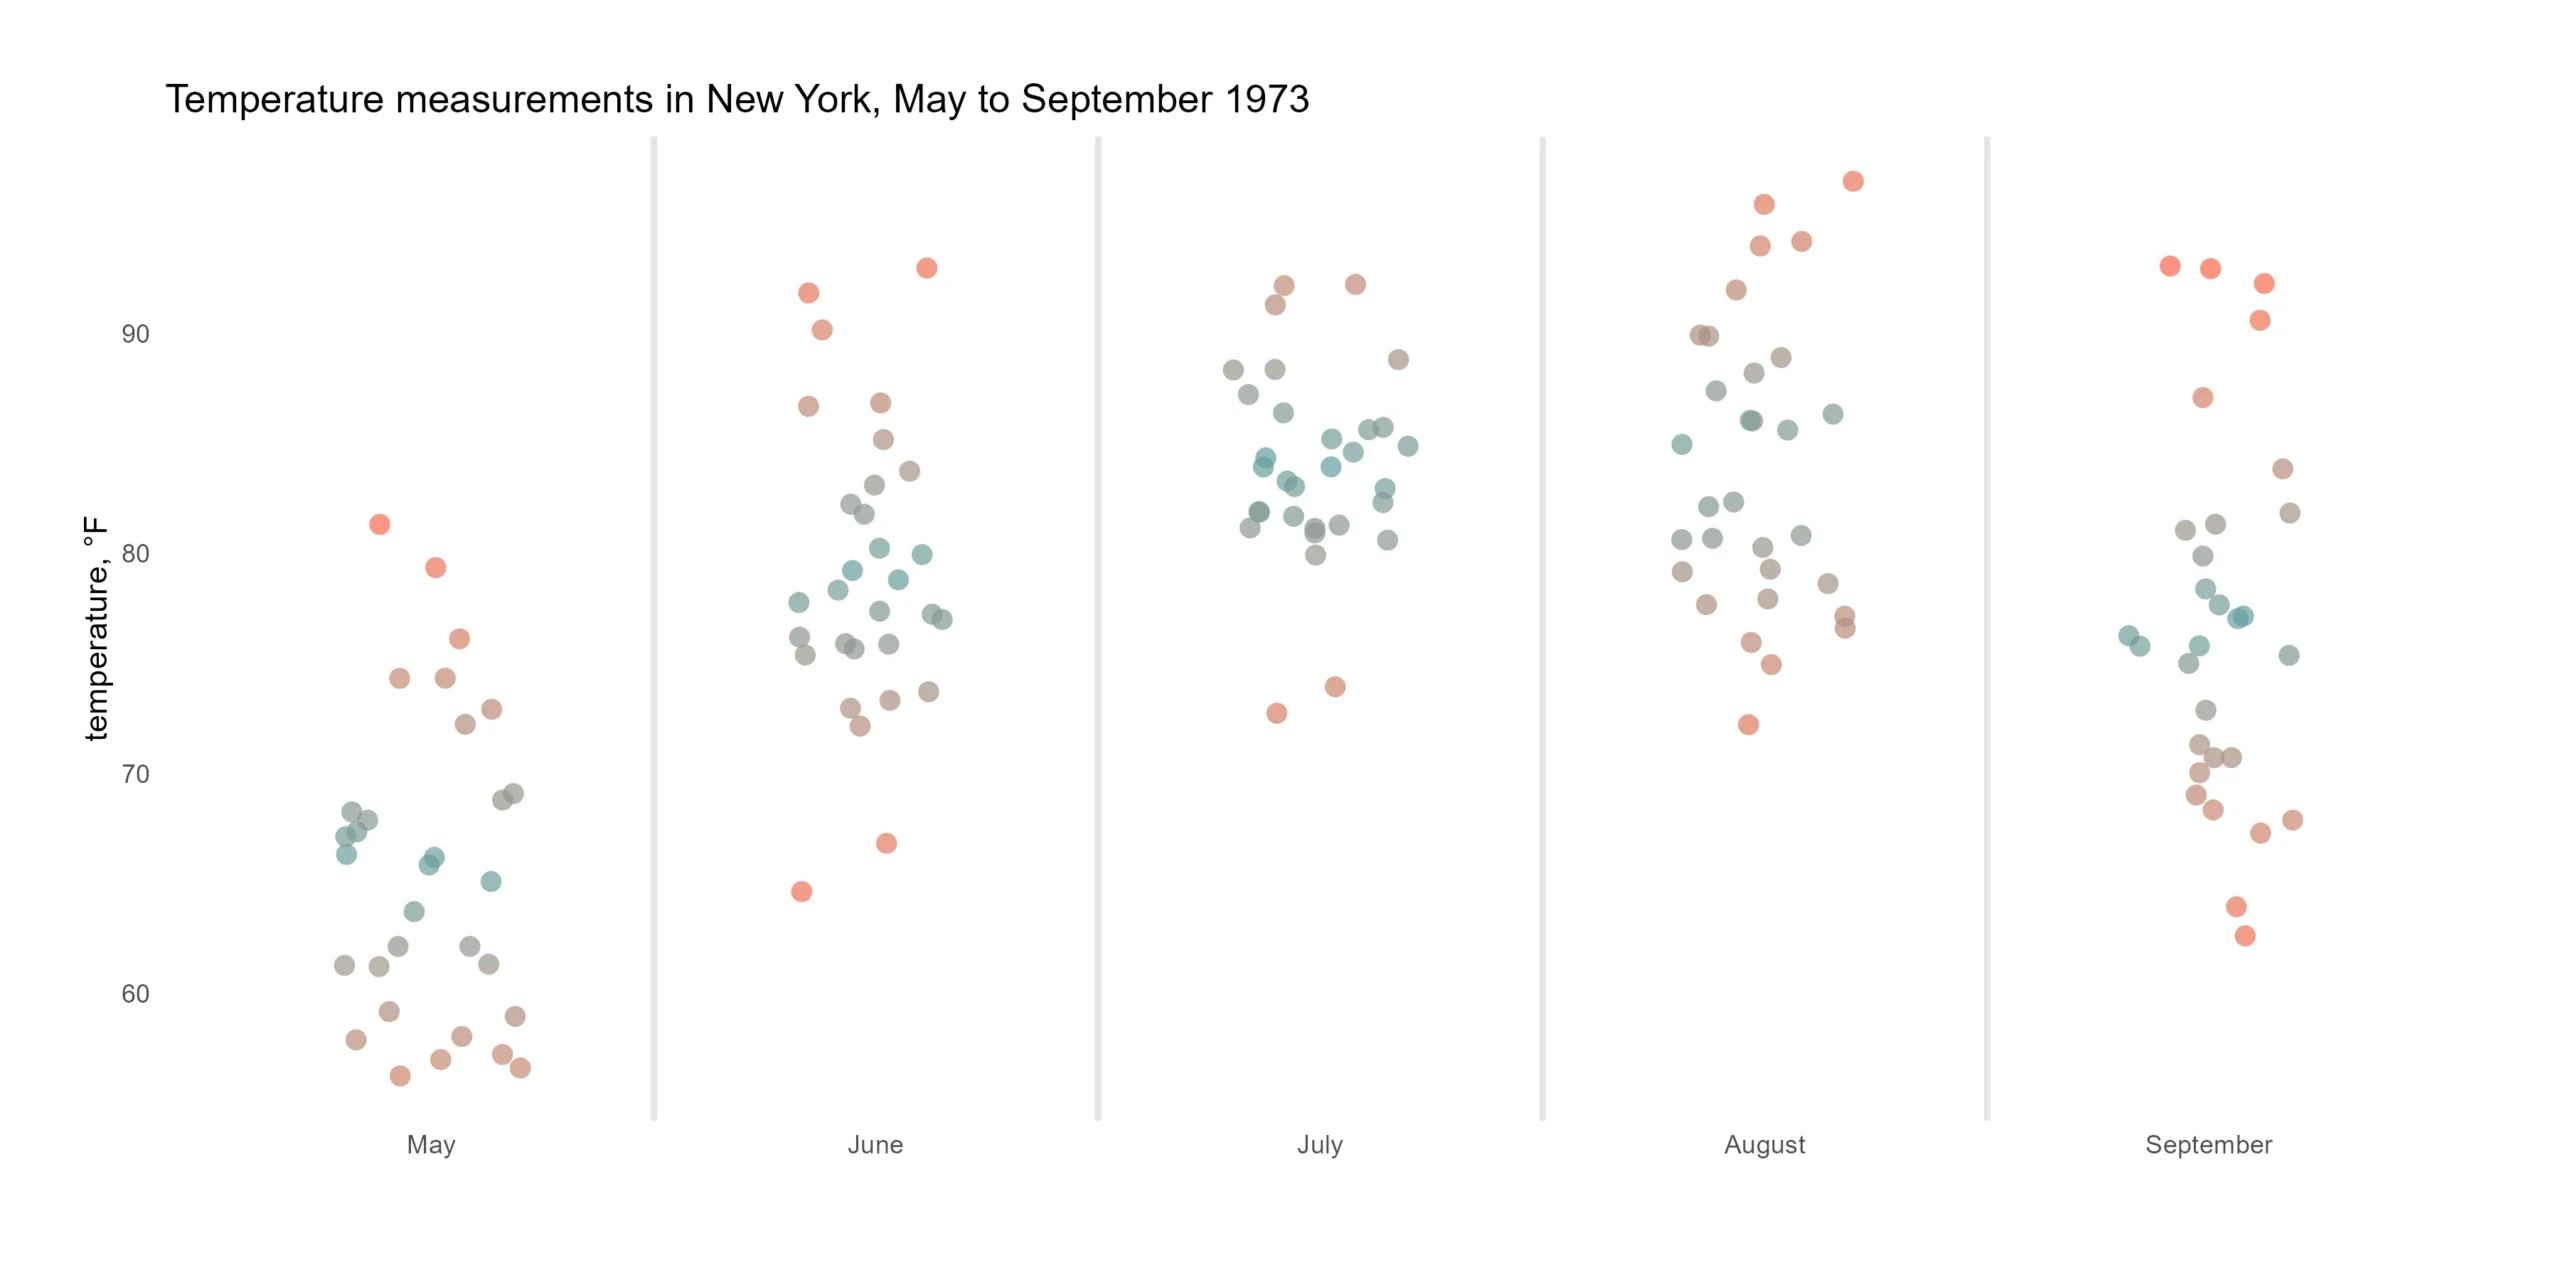
Here is how to use the color gradient in R jitter plot using midpoints or different gradients by a group. A good jitter plot in R makes it easier to view overlapping data points by categories. Color gradients might help to see differences better.
Tag: ggplot2 midpoint for each group
Plot mean by group in R using ggplot2 or use other measures

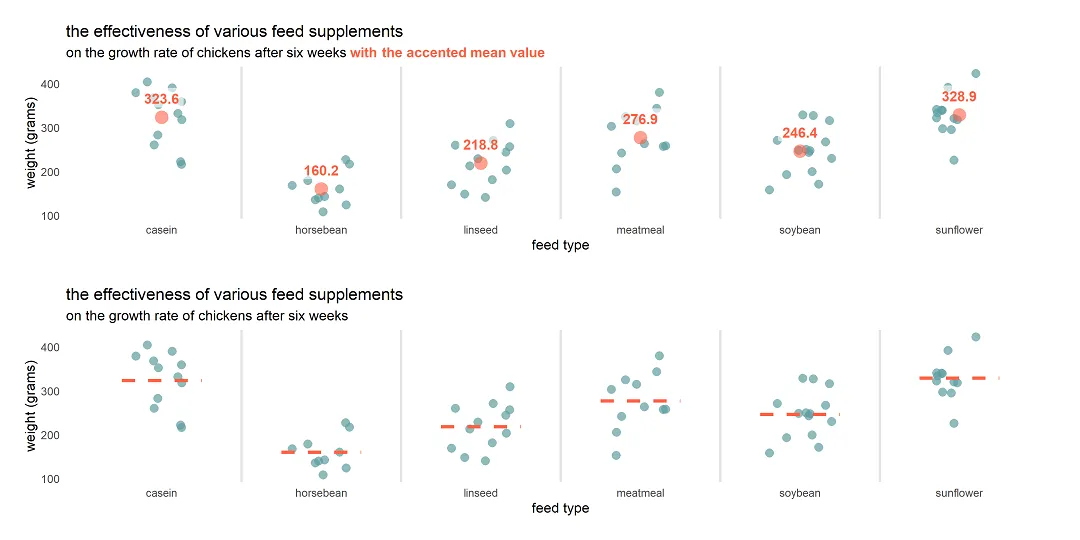
Here is how to plot mean by group in R using ggplot2 or try other measures to summarize values. To demonstrate that, I will use a jitter plot. A jitter plot is great if you want to look at all data points by categories, but additional statistics might be useful for evaluation.