When it is necessary to make the plot that is looking cleaner, you might want to remove gridlines in the ggplot2 plot or at least modify them.
Mainly gridlines are helpful if there is something to read against the plot axis. If it is not the case, try to remove them to improve your plot. There are different ways to modify the ggplot2 grid and make it less visible, for example, dotted lines or thickness.
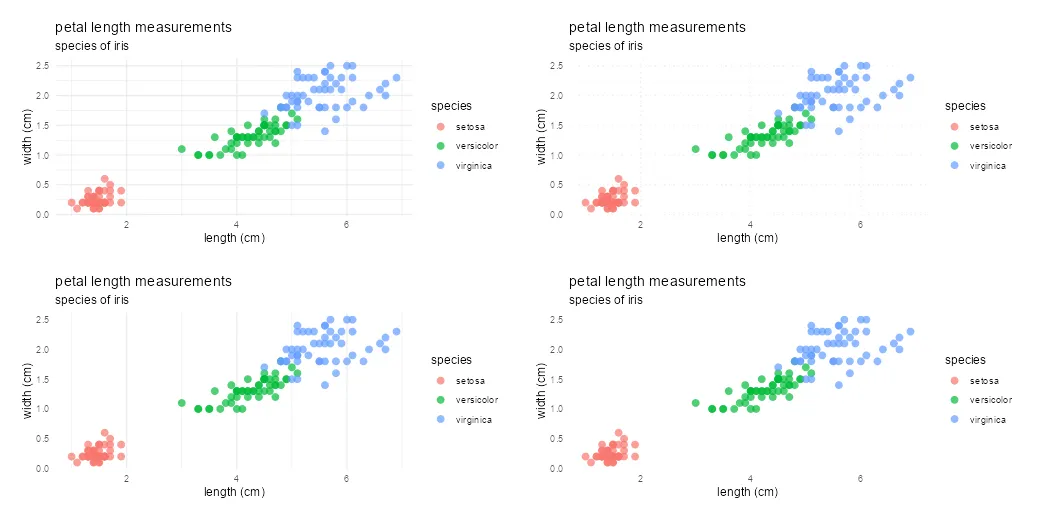
Here is my plot at the beginning.
require(ggplot2)

ggplot(iris, aes(x = Petal.Length, y = Petal.Width , color = Species)) +
  geom_point(size = 3,
             alpha = 0.7,
             shape = 16) +
  labs(
    title = "petal length measurements",
    subtitle = "species of iris",
    x = "length (cm)",
    y = "width (cm)",
    color = "species"
  ) +
  theme_minimal()
If you want to know more about R plot marker shapes, look at this post.
Remove gridlines in ggplot2
If you want to completely or partially remove the grid in ggplot2, it is easy to do by modifying theme elements. Here is how to remove that completely in ggplot2.
ggplot(iris, aes(x = Petal.Length, y = Petal.Width , color = Species)) +
  geom_point(size = 3,
             alpha = 0.7,
             shape = 16) +
  labs(
    title = "petal length measurements",
    subtitle = "species of iris",
    x = "length (cm)",
    y = "width (cm)",
    color = "species"
  ) +
  theme_minimal() +
  theme(panel.grid = element_blank())
If you are looking at theme components in the web browser, there is a long list. Hit Cltr+F and look for the keyword “grid” to see what is available.
Remove horizontal gridlines in ggplot2
ggplot(iris, aes(x = Petal.Length, y = Petal.Width , color = Species)) +
  geom_point(size = 3,
             alpha = 0.7,
             shape = 16) +
  labs(
    title = "petal length measurements",
    subtitle = "species of iris",
    x = "length (cm)",
    y = "width (cm)",
    color = "species"
  ) +
  theme_minimal() +
  theme(panel.grid.minor.y = element_blank(),
        panel.grid.major.y = element_blank())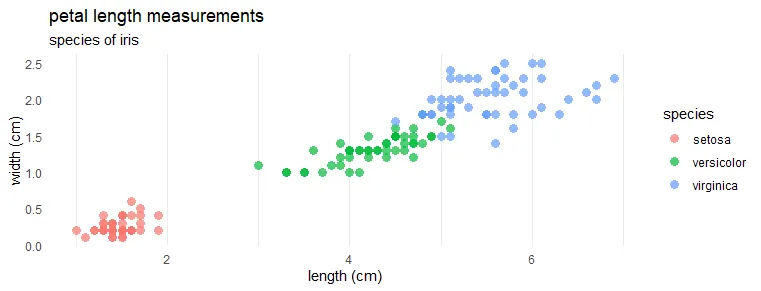
Remove vertical gridlines in ggplot2
ggplot(iris, aes(x = Petal.Length, y = Petal.Width , color = Species)) +
  geom_point(size = 3,
             alpha = 0.7,
             shape = 16) +
  labs(
    title = "petal length measurements",
    subtitle = "species of iris",
    x = "length (cm)",
    y = "width (cm)",
    color = "species"
  ) +
  theme_minimal() +
  theme(panel.grid.minor.x = element_blank(),
        panel.grid.major.x = element_blank())
ggplot2 theme without grid
If you want to remove or modify the grid in ggplot2, try different themes that already do that. Besides the ggplot2 theme_classic that provides result without the grid, there is also great packages like the ggthemes.
ggplot(iris, aes(x = Petal.Length, y = Petal.Width , color = Species)) +
  geom_point(size = 3,
             alpha = 0.7,
             shape = 16) +
  labs(
    title = "petal length measurements",
    subtitle = "species of iris",
    x = "length (cm)",
    y = "width (cm)",
    color = "species"
  ) +
  theme_classic()
require(ggthemes)

ggplot(iris, aes(x = Petal.Length, y = Petal.Width , color = Species)) +
  geom_point(size = 3,
             alpha = 0.7,
             shape = 16) +
  labs(
    title = "petal length measurements",
    subtitle = "species of iris",
    x = "length (cm)",
    y = "width (cm)",
    color = "species"
  ) +
  theme_tufte()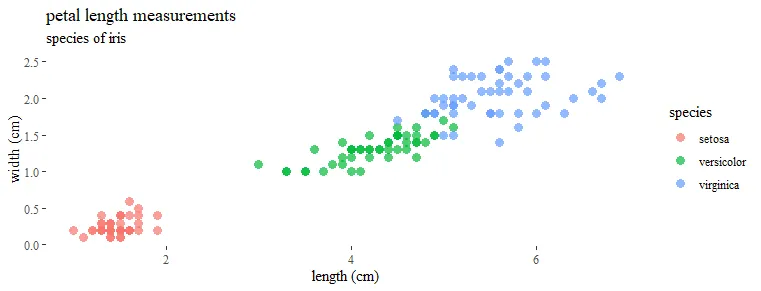
Modify gridlines in ggplot2
Sometimes grid in the plot is necessary but less visible. You can do that by changing color, width, or line type.
If you want to get a grid with dotted lines in ggplot2, here is how it looks.
ggplot(iris, aes(x = Petal.Length, y = Petal.Width , color = Species)) +
  geom_point(size = 3,
             alpha = 0.7,
             shape = 16) +
  labs(
    title = "petal length measurements",
    subtitle = "species of iris",
    x = "length (cm)",
    y = "width (cm)",
    color = "species"
  ) +
  theme_minimal() +
  theme(panel.grid = element_line(linetype = 3))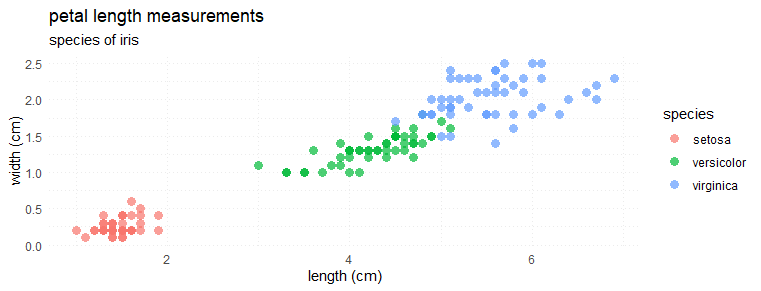
Modify ggplot2 grid line thickness with the size argument and try to play around with major and minor gridlines separately.
ggplot(iris, aes(x = Petal.Length, y = Petal.Width , color = Species)) +
  geom_point(size = 3,
             alpha = 0.7,
             shape = 16) +
  labs(
    title = "petal length measurements",
    subtitle = "species of iris",
    x = "length (cm)",
    y = "width (cm)",
    color = "species"
  ) +
  theme_minimal() +
  theme(panel.grid.major = element_line(size = 1),
        panel.grid.minor = element_line(size = 1))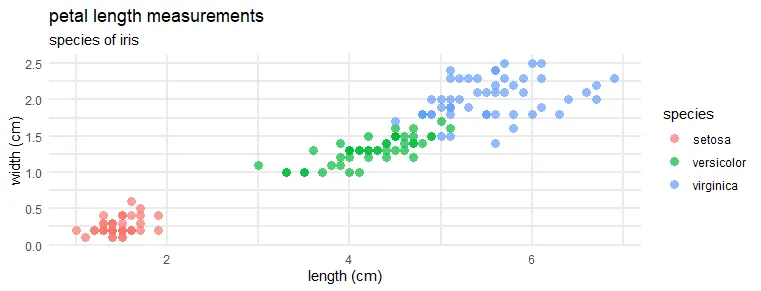
Leave a Reply