
Sometimes you might wonder how to remove the border around dots in ggplot2, but all you have to do is change the marker shape in the R plot. When creating a plot in R that contains markers, it is possible to adjust the color, transparency, and also shape.
Look at the marker shapes in R
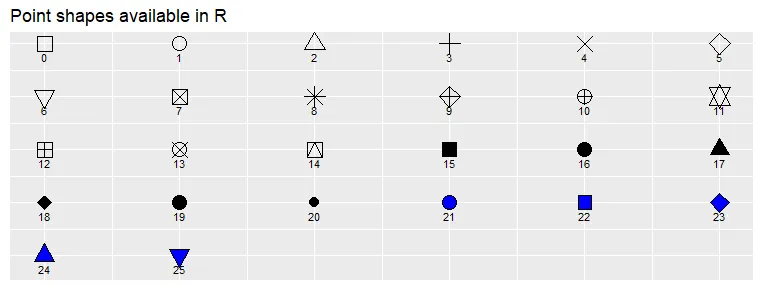
Here is a way to quickly overlook all the possible point shapes in R.
ggpubr::show_point_shapes()
If you want to look at different colors for those shapes or compare different formatting options, you can double-click on the function show_point_shapes and modify that code. Here is how it looks.
require(ggplot2)
require(ggpubr)

d = data.frame(p = c(0:25))

p <- ggplot() +
  scale_y_continuous(name = "") +
  scale_x_continuous(name = "") +
  scale_shape_identity() +
  geom_point(data = d,
             mapping = aes(x = p%%6, y = p%/%6, shape = p),
             size = 6, alpha = 0.4, stroke = 1.5,
             color = "turquoise2", fill = "sienna2") +
  geom_text(data = d,
            mapping = aes(x = p%%6, y = p%/%6 + 0.25, label = p),
            size = 4) +
  scale_y_reverse() +
  theme_dark() +
  theme(axis.title = element_blank())

ggpar(p, ticks = FALSE, tickslab = FALSE,
      main = "Point shapes available in R")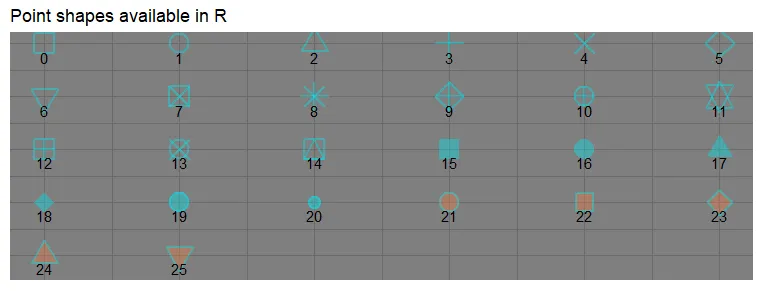
In this way, you might see more clearly that in the scenario when you want to get a transparent point without a border, the best option is number 16.
Change the marker shape in the ggplot2
Here is an example with a scatter plot. By default, the data point contains a tiny border that might not be necessary.
ggplot(iris, aes(x = Sepal.Length, y = Sepal.Width, color = Species)) +
  geom_point(size = 3, alpha = 0.5) +
  scale_color_brewer(palette = "Dark2") +
  theme_minimal()
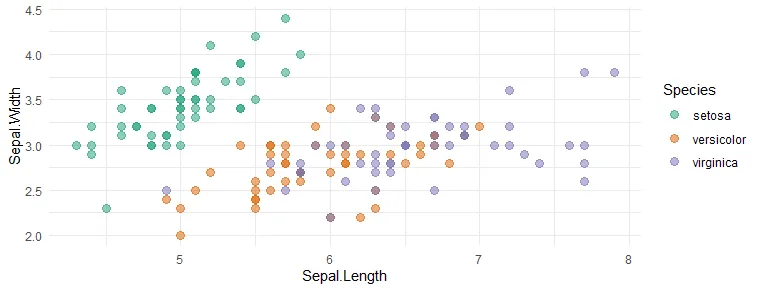
The shape of the point without a border in the ggplot2 scatter plot looks like this. You can get that by adjusting the shape argument.
ggplot(iris, aes(x = Sepal.Length, y = Sepal.Width, color = Species)) +
  geom_point(size = 3, alpha = 0.5, shape = 16) +
  scale_color_brewer(palette = "Dark2") +
  theme_minimal()

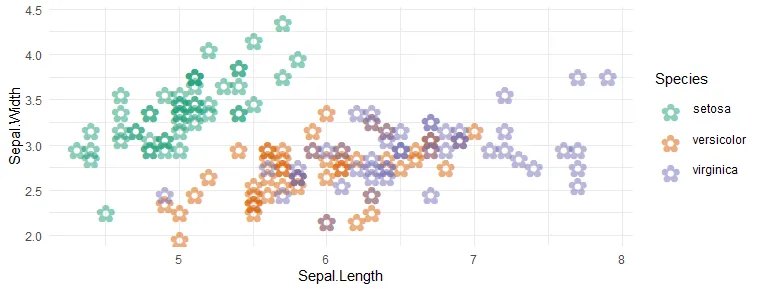
The ggplot2 might contain a wide variety of symbols that you can copy and paste inside that argument. For example, here is the R scatter plot with a data point in the shape of a flower.
ggplot(iris, aes(x = Sepal.Length, y = Sepal.Width, color = Species)) +
  geom_point(size = 8, alpha = 0.5, shape = "✿") +
  scale_color_brewer(palette = "Dark2") +
  theme_minimal()
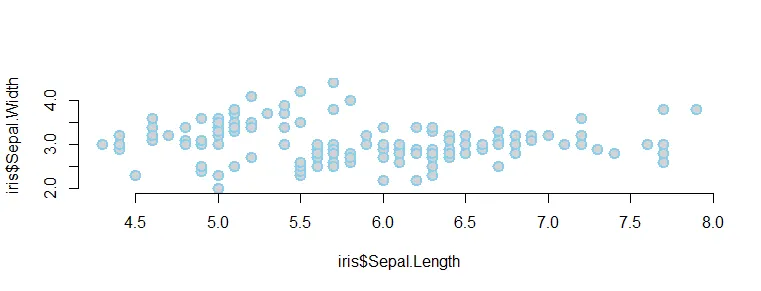
Change the marker shape in the base R
To change how the shape of the data point looks in the plot in the base R, try to use the pch parameter.
plot(
  x = iris$Sepal.Length, y = iris$Sepal.Width,
  pch = 21,
  cex = 1.5,
  lwd = 2,
  col = "sky blue",
  bg = "light gray",
  frame.plot = FALSE
)
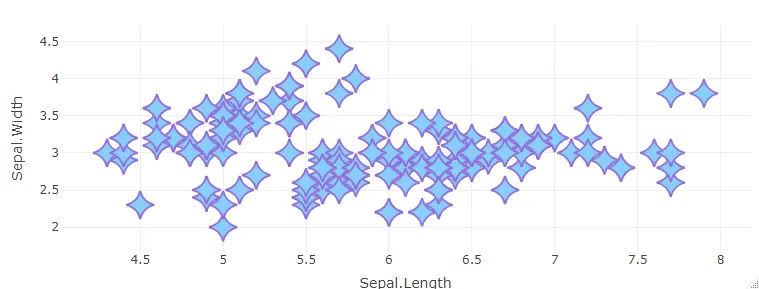
Change the data point shapes in the R plotly
If you want to change the data point shape in the R plotly and you are good at ggplot2, try to use the ggplotly function.
Otherwise, here is how to change marker shape in plotly by using symbol argument.
require(plotly)

plot_ly(
  iris,
  x = ~ Sepal.Length,
  y = ~ Sepal.Width,
  type = "scatter",
  mode = "markers",
  marker = list(
    color = 'LightSkyBlue',
    size = 20,
    symbol = 22,
    line = list(color = 'MediumPurple',
                width = 2)
  )
)
You can read more about the plotly marker symbols here.
Thank you for reading this post and please take a look at other posts from this blog about data visualization or other stuff. For example, how to save R plots or other results temporarily or convert to WebP format.
Leave a Reply