
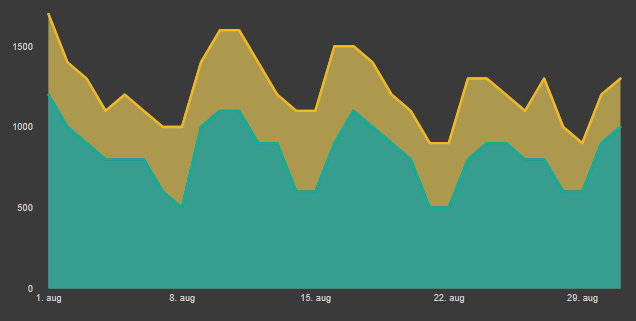
Here is how to create a Power BI chart with an accented gap between two lines. With the help of fill color between two lines, it will help you evaluate the difference between two values.
This kind of visualization may work only in specific situations where variables are not overlapping. This visualization will work if you are focusing on the gap between two variables, benchmark range, or a gap between forecasting models.
The main idea is that you are creating sequential layers of area charts. Each part will reveal only the necessary information. Here is a visual representation of this principle.
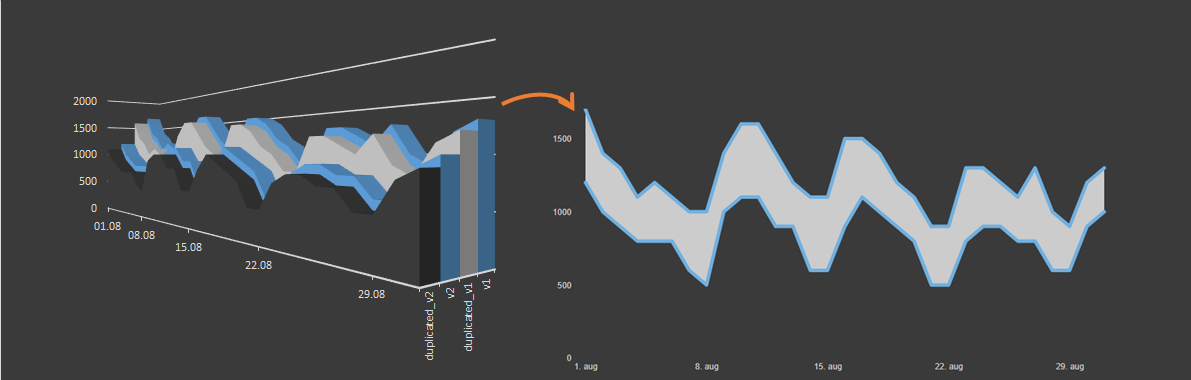

Creation of Power BI chart with the accented gap between two lines
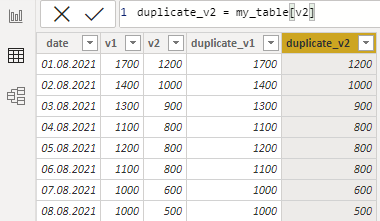
- Create a duplicate for each series that you will show in the area chart.
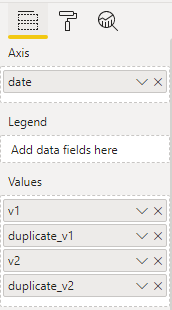
- Choose an area chart.
- Add necessary series to area chart in definite order – by starting with largest.


Right now, it is not looking great, but it is time to do the necessary formatting.
- Change Y axis starting point to 0 if necessary and remove unnecessary clutter – legend, gridlines, etc.
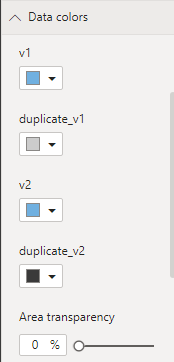
- In the data colors section of the formatting tab, change the area transparency to 0.
- Choose matching colors for the two data series, the first duplicate should be in the gap color and the second duplicate matching background color. If your background is in the custom color, you can use this trick to pick a necessary color with a PowerPoint eyedropper.
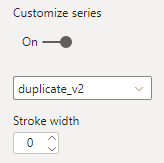
- Go to the Shapes section and turn on customize series switch. Remove stroke width for the duplicate series and make that greater for other series.


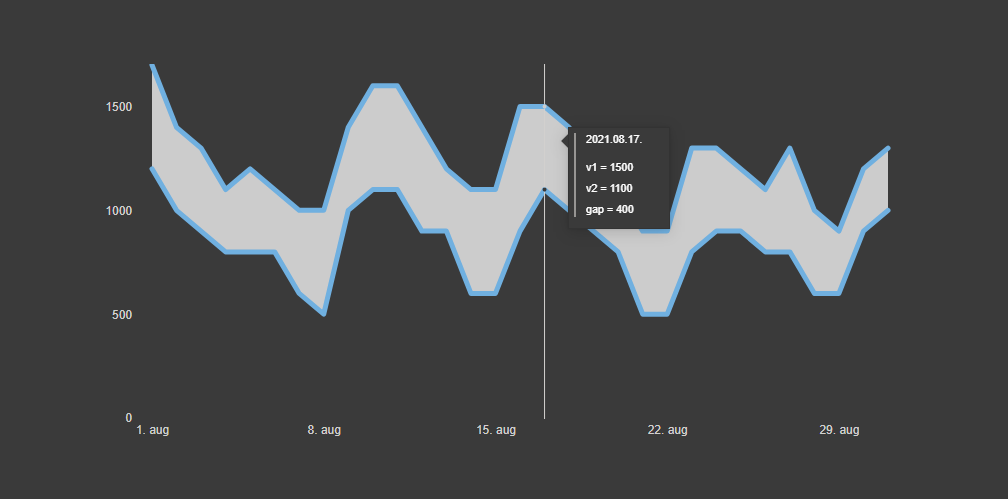
As a result, you will get a Power Bi chart with an accented gap between two lines similar to this, and you can customize it as necessary.
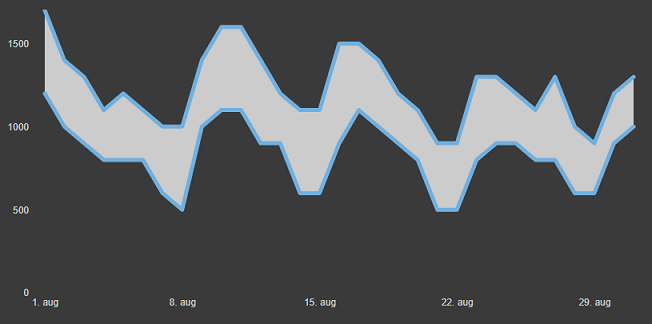

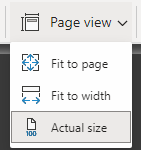
If you see additional lines to your chart, then change the page view to actual size.

As the result, the chart tooltip contains unnecessary information, but you can fix that with the custom tooltip.
Here is a pbix file that contains the final result.