Tag: Shading is between two Power BI line chart lines
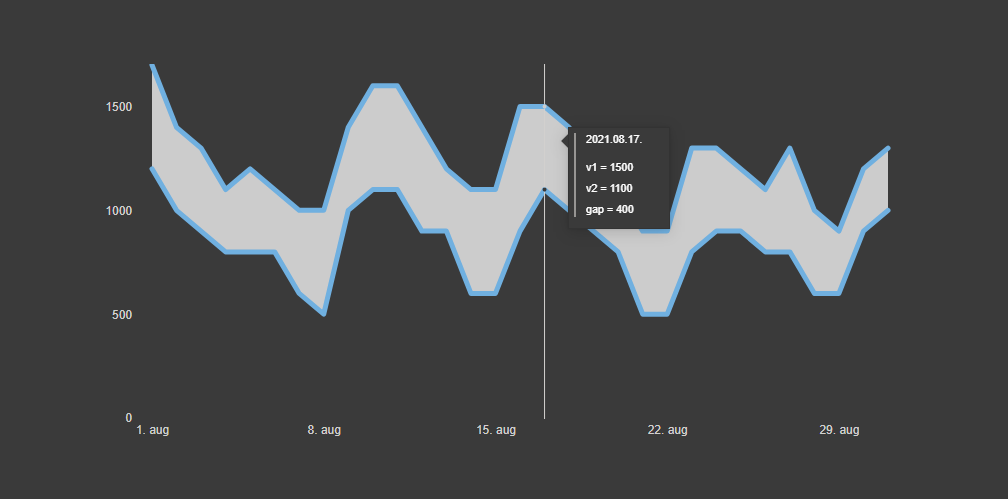
Power BI chart with the accented gap between two lines
Here is how to create a Power BI chart with an accented gap between two lines. With the help of fill color between two lines, it will help you evaluate the difference between two values.