Convert R TRUE and FALSE values to 1 and 0, and vice versa
Here is a simple method to convert R TRUE and FALSE values to 1 and 0, and vice versa.
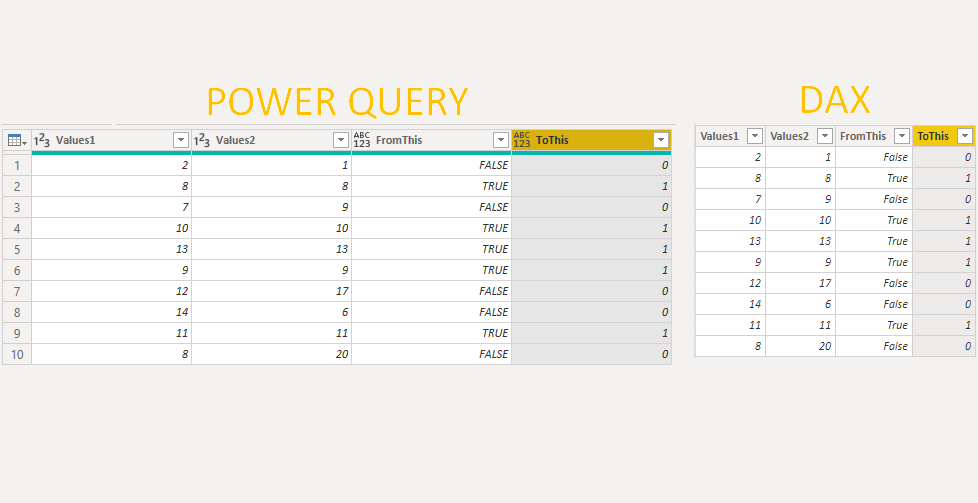
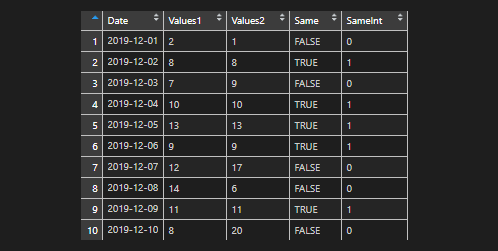
Convert TRUE and FALSE into 1 and 0 in Power BI
Here is a simple way how to convert TRUE and FALSE into 1 and 0 in Power BI. Precisely speaking – Power Query and DAX.
in

Convert TRUE and FALSE values to 1 and 0 in Excel
Here is a simple trick that is not so obvious. By adding two minus signs before calculation, you can convert TRUE, FALSE into 1, 0 in Excel. =–(A2=B2)
in
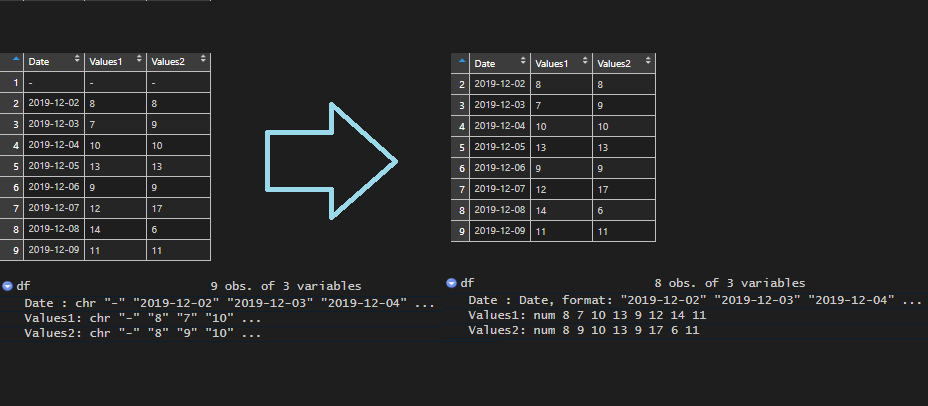
Auto-detect R data frame column data types
Here is how to auto-detect and change data types for multiple columns in R at the same time.
in
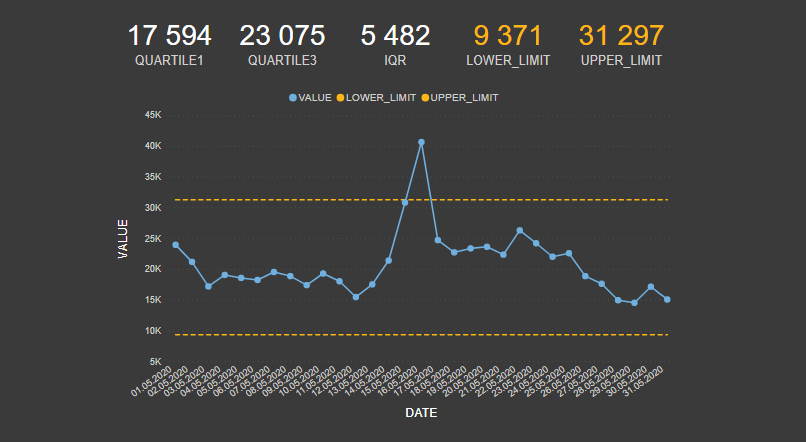
How to identify outliers in Microsoft Power BI
One of the simplest methods that you can detect outliers in Power BI is visual detection and IQR method that is also used in box plots (sometimes called box and whisker plot).
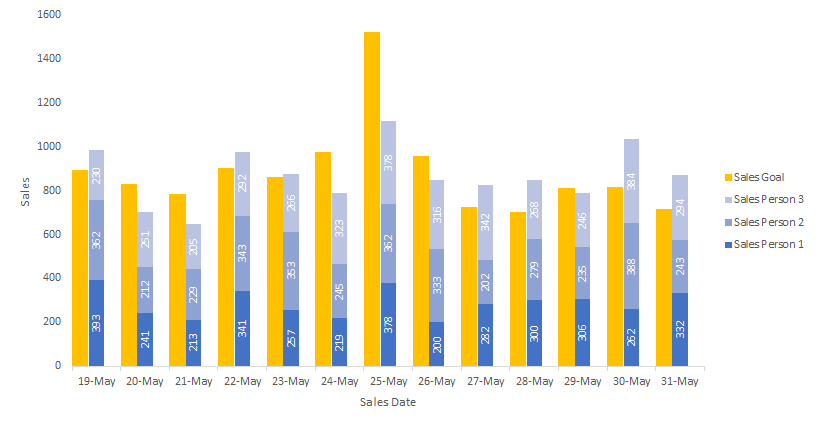
Clustered and stacked columns in one Excel chart – 5 easy steps
If you want to create an Excel chart that contains clustered columns and stacked columns altogether, this post is for you.
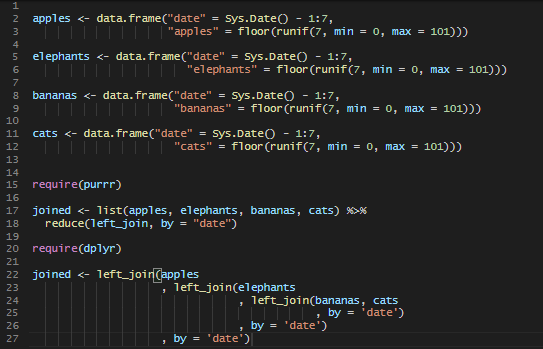
Multiple left joins in R
Here is a quick and easy way to perform multiple left joins in R with multiple data frames.
in
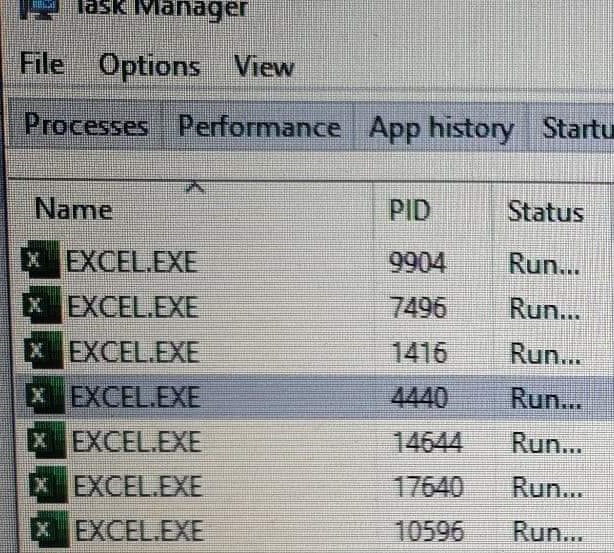
How to close EXCEL.EXE from Windows command line
In the last days, I was running into a problem that even all Excel files are closed bunch of EXCEL.EXE processes still running. Here is how to close all EXCEL.EXE at once.
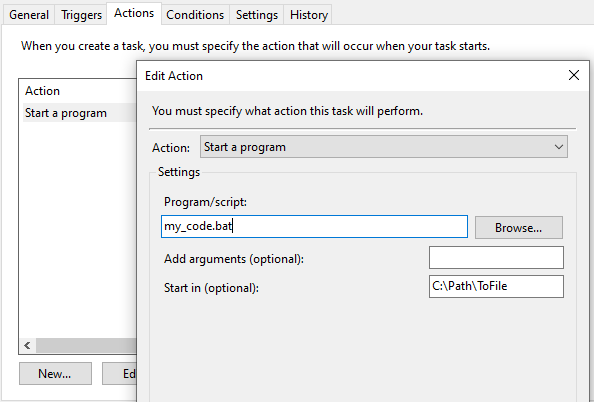
How to schedule batch file in Windows 10 Task Scheduler
Here is how to schedule a batch file in Windows Task Scheduler.
How to run Windows batch file from R script
For me, it worked like this, but there is also modification needed in the actual batch file. system(“cmd.exe”, input = paste(‘C:\\This\\Is\\Path\\Your.bat’)) In the batch file, I added exit command at the end because that was running in an endless loop. On the other hand, endless loops with proper timing and conditions in the batch…