

Here is how to create a simple near real time Power BI dashboard that will work without extra costs or complicated authorization. The hardest part is to get the data often enough. But if you are familiar with programming languages like R or Python, or other tools that can run from the Windows command line… Continue reading How to create simple near real time dashboard in Power BI
Day of the week number in R


There is R base function like weekdays that can return the name of the weekday. But what if you want to get the day of the week number in R to do calculations? Here is how to do that by using one of the most popular R packages.
Use ifelse across a range of R data frame columns

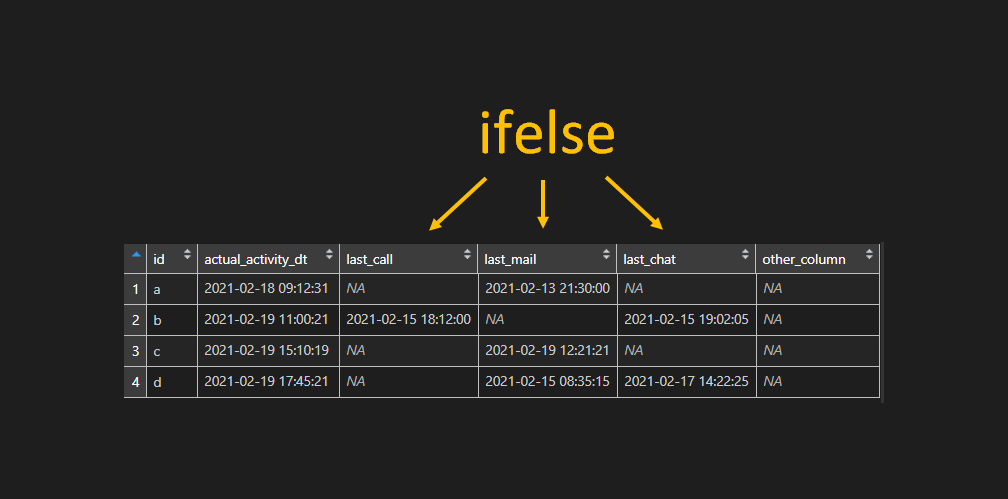
Here is how to apply the ifelse function across a range of multiple R data frame columns. Sometimes it is necessary to do calculations by a condition and it could be time-consuming to do that for each of multiple columns. Or even worse. Maybe the necessary columns are changing position over time and you have… Continue reading Use ifelse across a range of R data frame columns
ISO week number and ISO year in R


The easiest way to do ISO week number and ISO year calculations in R is by using two simple functions from package lubridate.
Variance or other calculation across columns in R
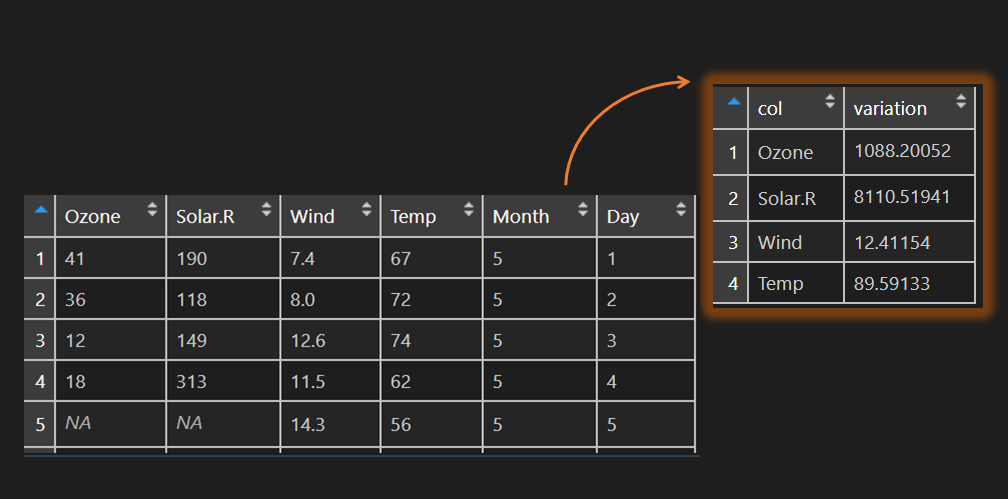
Here is how to calculate variance across columns in the R data frame. The same technique can be useful in other situations. Like in this other example. Get a count of NA values for each of the columns in the R data frame.
Group index that restarts in R

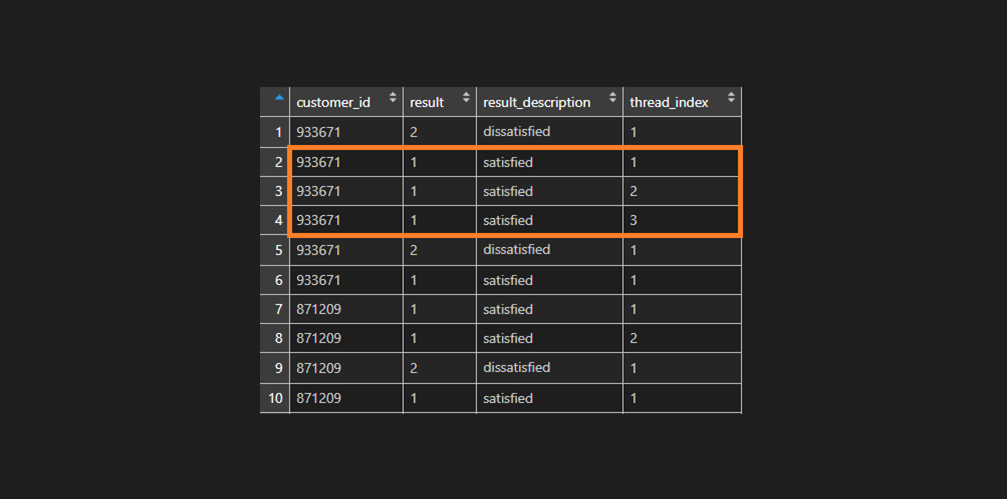
Here is how to generate a group index in R that restarts every time there change in variables.
Running, moving, rolling average in R, dplyr
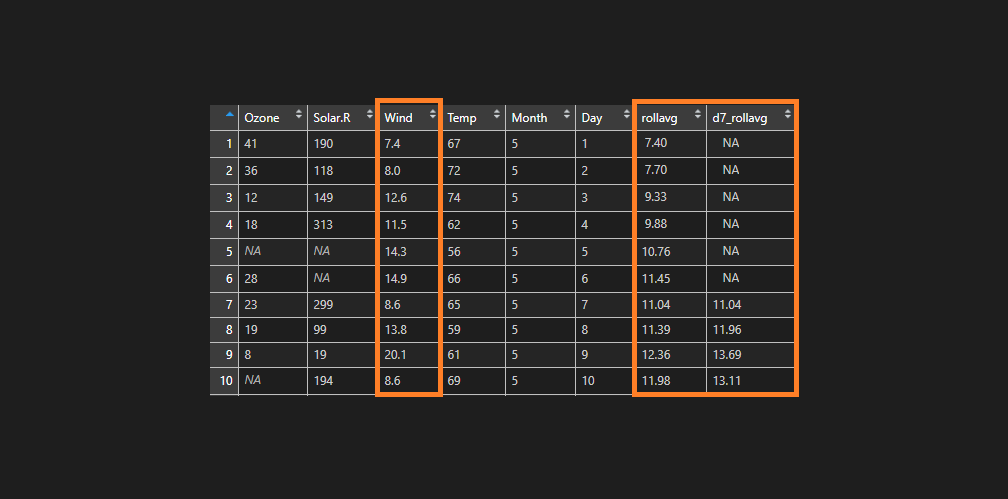
You can calculate the moving average (also called a running or rolling average) in different ways by using R packages.
Combine apply and match in R, return the name of the column
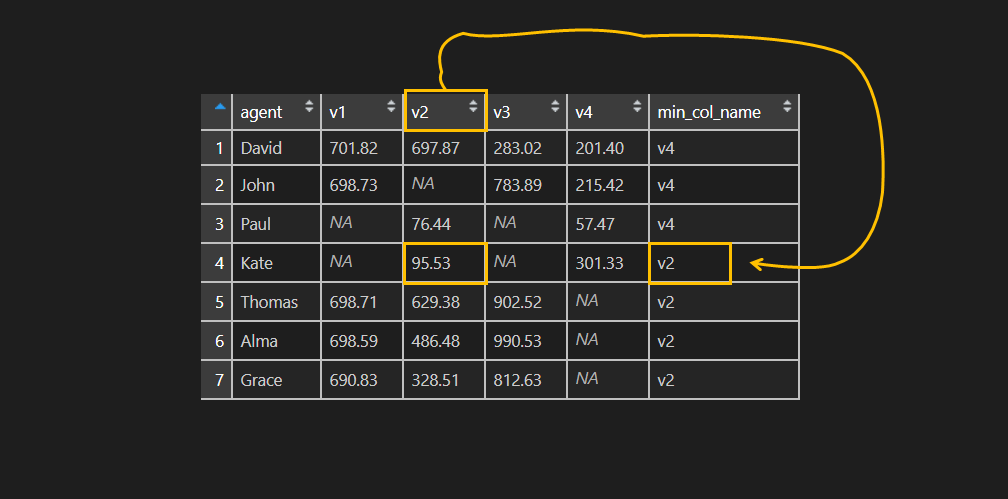
Here is how to use functions apply and match together in R and a result – return the name of the column that contains minimum or maximum.
Edit R data frame almost like in Excel

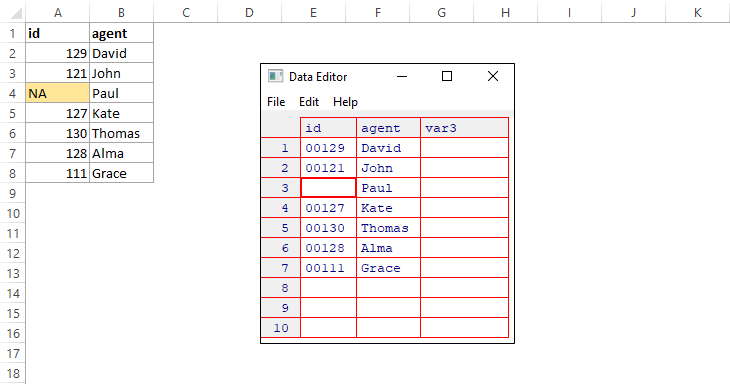
Do you want to edit R data frame like an Excel table? It is not possible the same way. But on the other hand, there is a solution that is comfortable enough to edit a few entries.
R “not in” operator, opposite of “in”


R operator %in% is handy for working with vectors, but how to use it oppositely? Something like %notin% that will exclude anything that is in a vector.