Tag: Running average in R
Plot moving average in R using ggplot2
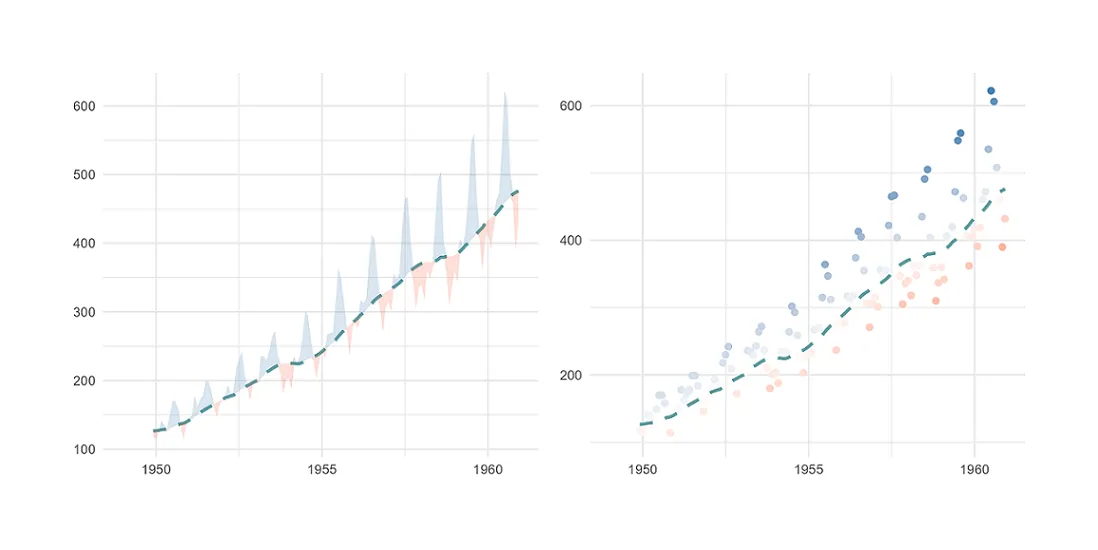
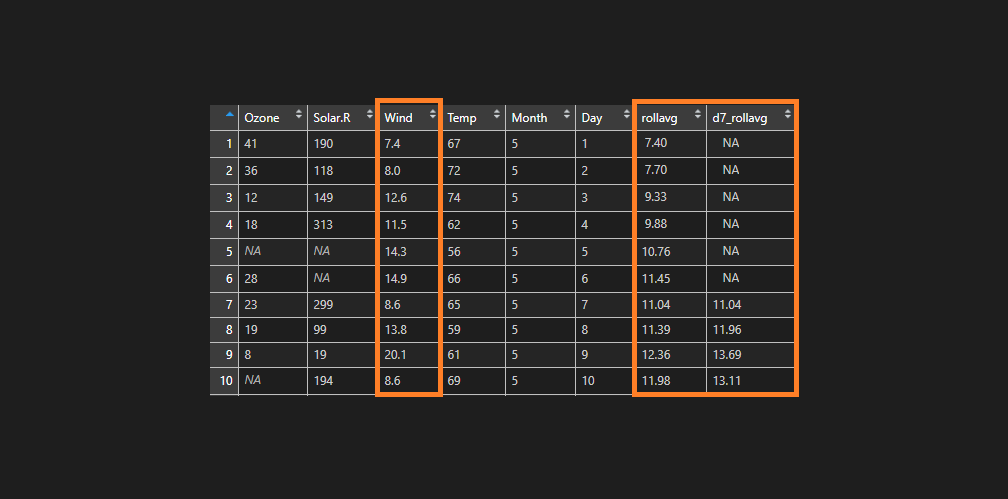
Here is how to plot the moving average (rolling average or running average) in R using ggplot2 and add actual data in different ways. In that way, you can track the moving average and look at the data around that. Sometimes it helps to spot anomalies in time series.
Running, moving, rolling average in R, dplyr
You can calculate the moving average (also called a running or rolling average) in different ways by using R packages.