How to calculate ISO week number and ISO year in DAX
ISO week number and ISO year calculation in DAX might be the best solution if you’re using the Power BI calculated table. They will give you the dimension of weeks with the same number of days and work for multiple years.
in
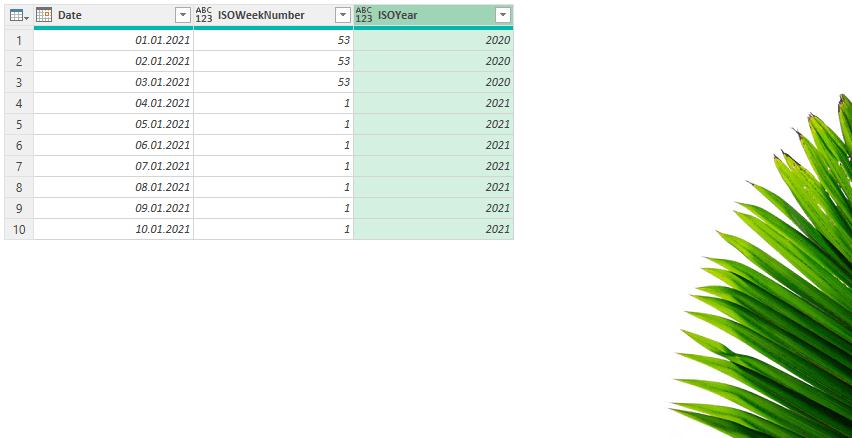
How to calculate ISO year in Power Query
ISO year in Power Query is necessary if you have multiple years and want to group data using ISO week number. Some of the dates at the end or beginning of the year might belong to another year.
How to calculate ISO week number and ISO year in Excel
Excel is one of the most popular tools to work with data with more than 400 different functions. Some of them are great to calculate ISO week number in Excel, but ISO year is not so easy.
in

Calculate last or previous value within Power BI
Here is how to calculate last, previous, or values other periods ago in Power BI using DAX measures. It is not always straightforward, and there are multiple approaches to how to do that.
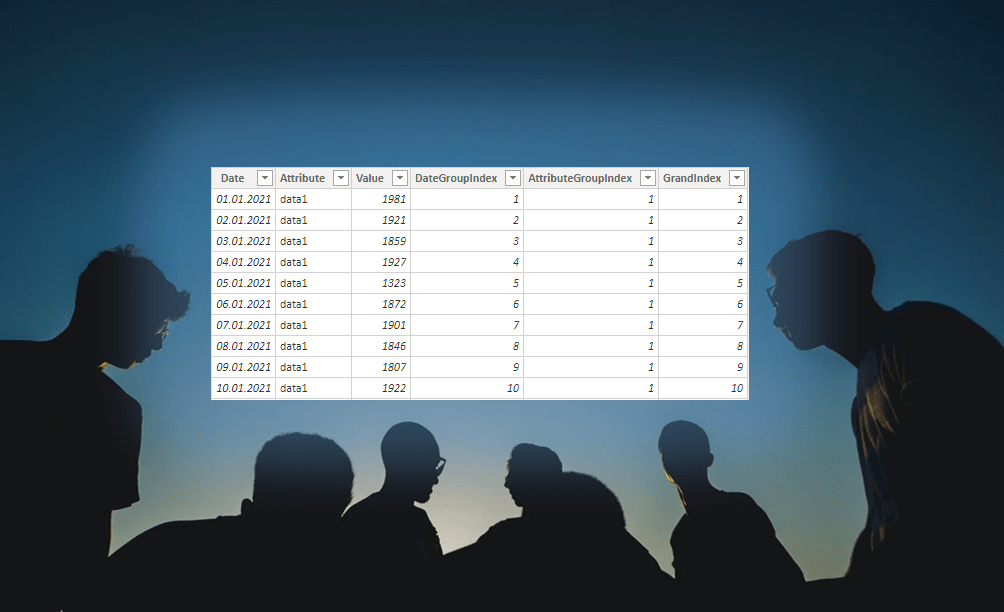
Create group index column by using DAX
One way to create a group index by using DAX is with the function RANKX. How to do that depends on your dataset structure, but this example might give you a good idea or precise solution.
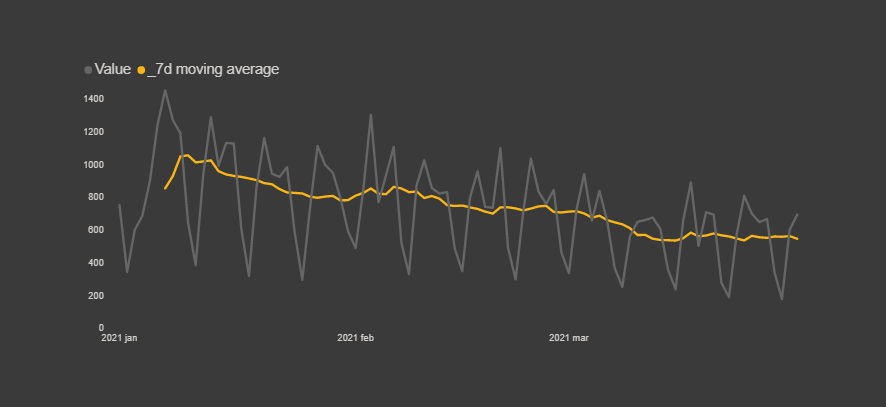
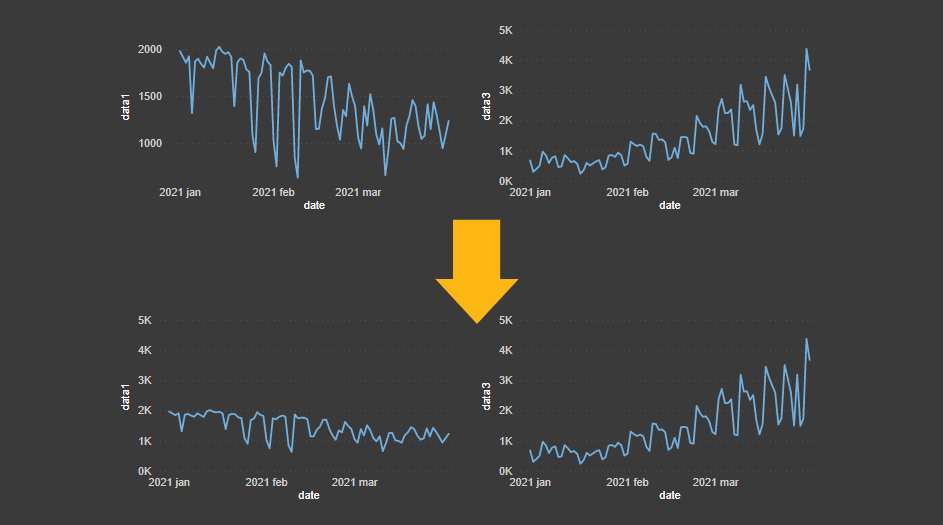
How to calculate moving average or sum in Power BI
A moving average can help to see data insights that sometimes are a little bit hidden behind seasonality. Here is how to calculate a moving average or sum in Power BI by using DAX. Sometimes moving average is called running or rolling average, but it is all the same.
in
How to highlight one line chart series among many in Power BI
If you have multiple line chart series in one chart, then here is how to highlight one series among many in Power BI dynamically. That will enhance the ability to analyze data and compare one series to others.
How to create a dynamic histogram in Power BI with adjustable bins
Here is how to create a dynamic histogram in Power BI. It changes with the help of a slicer that regulates data distribution groups (adjustable bins).
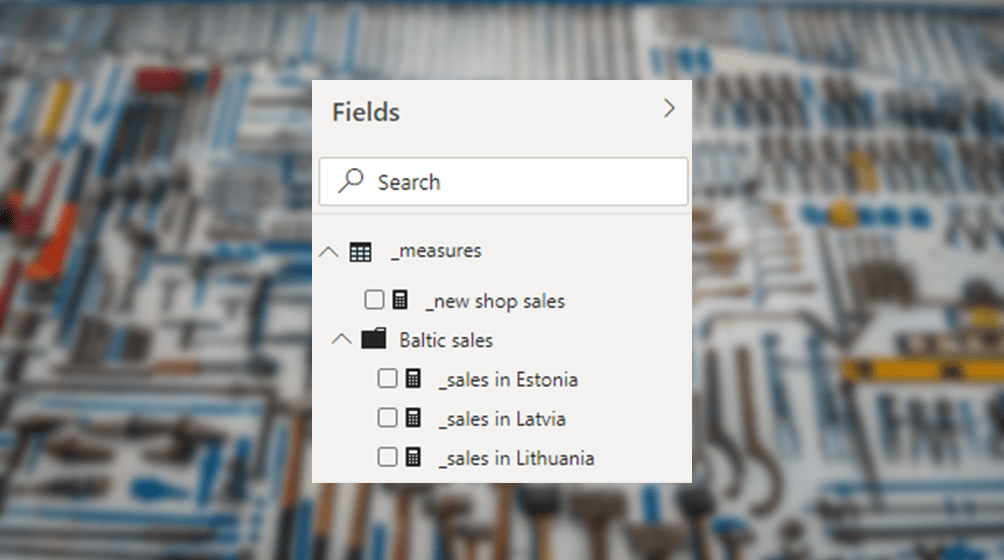
4 ways how to organize DAX measures in Power BI
Here are my favorite ways to organize DAX measures in Power BI that can save plenty of your time in larger projects.
in