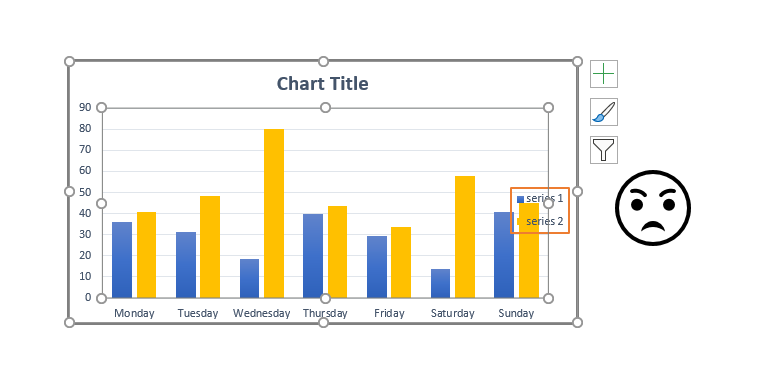
For me, the most annoying thing about Excel charts are is the inability to resize elements automatically. Usually, it happens after mild corrections of the plot area. Here is how to fix that and reset the Excel chart plot area to get back automatic size adjustments.
Usually, the problem with Excel chart plot area resizing happens when you are accidentally or deliberately make size changes. A few adjustments of plot area causing annoying overlap with the legend.
The fastest method to reset the Excel chart plot area are is by using this 3 step method.
- Select an Excel chart that has a problem.
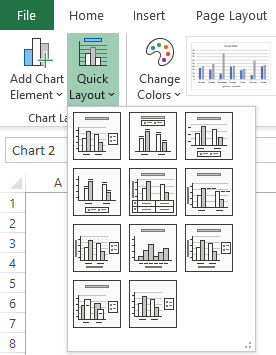
- Go to the Chart Design tab.
- Choose one of the Quick Layout options.
Now your Excel plot area will get bach default behavior to resize automatically. In addition, it might reset Excel chart formatting that is unnecessary, but the benefit is greater.
In my opinion Excel Quick Layout tool is underrated. If you need Excel chart axis titles and other elements, then Quick Layout is faster than choosing each element one by one.
Here is another less-known Excel data visualization tip – a quick method to copy formatting from one chart to another. It is simple as copy and pastes if you know how to do that.
Do you know the fastest method how to pick custom colors for your Excel project? Check this out.
Do you ever use histograms? Very useful and easy to create a visualization in Excel.
Leave a Reply