Here are multiple examples of getting the sum by group in R using the base, dplyr, and data.table capabilities. Depending on the situation, you can choose in your scenario what is the best solution.
My data set looks like this.
df <- structure(list(Chicken = c("Molly", "Molly", "Molly", "Molly",
                                 "Molly", "Molly", "Molly", "Dolly",
                                 "Dolly", "Dolly", "Dolly",
                                 "Dolly", "Dolly", "Dolly"),
               Location.during.daytime = c("Inside",  "Outside", "Outside",
                                           "Inside", "Inside", "Outside",
                                           "Inside", "Inside", "Outside",
                                           "Inside", "Outside", "Inside",
                                           "Outside", "Inside"),
               Eggs.laid = c(0L, 1L, 1L, 1L, 2L, 2L,
                             0L, 2L, 2L, 0L, 2L, 3L, 0L, 0L),
               Sales.in.EUR = c(NA, 0.2, 0.2, 0.2, 0.4, 0.4, NA,
                                0.4, 0.4, NA, 0.4, 0.6, NA, NA)),
          class = "data.frame", row.names = c(NA, -14L))

head(df)

#Chicken Location.during.daytime Eggs.laid Sales.in.EUR
# 1   Molly                  Inside         0           NA
# 2   Molly                 Outside         1          0.2
# 3   Molly                 Outside         1          0.2
# 4   Molly                  Inside         1          0.2
# 5   Molly                  Inside         2          0.4
# 6   Molly                 Outside         2          0.4
It contains 2 columns with categories and 2 columns with numerical values. That will help to demonstrate how to solve different needs for sum by the group in R.
Calculate the sum by a group in R using dplyr
With functions from dplyr, you can solve multiple scenarios when it is necessary to sum by a group. Here is a simple one.
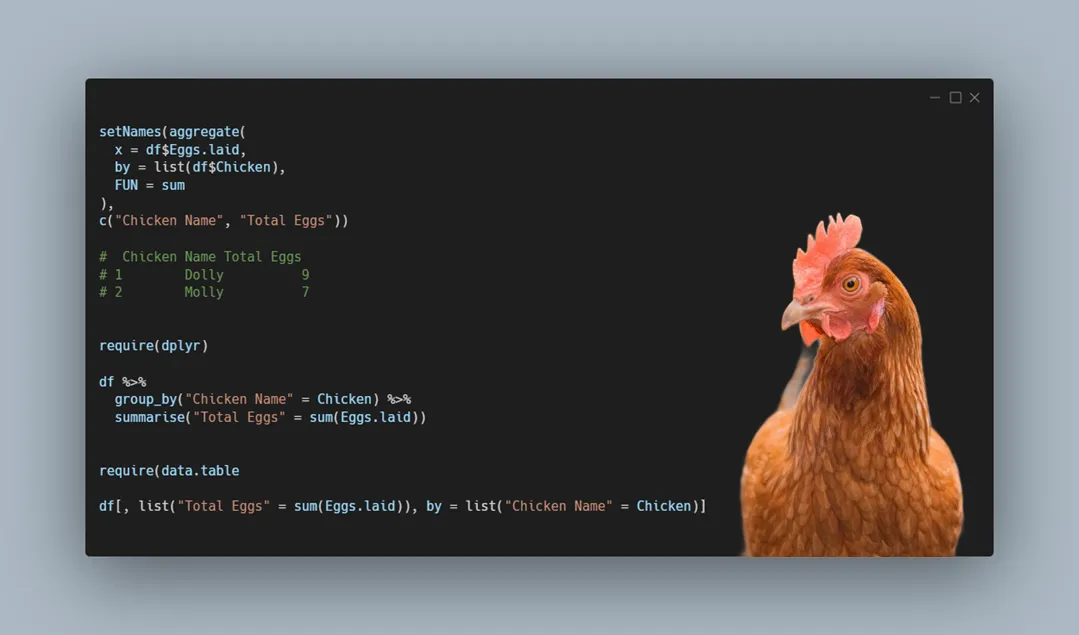
require(dplyr)

df %>%
  group_by("Chicken Name" = Chicken) %>%
  summarise("Total Eggs" = sum(Eggs.laid))

#  Chicken Name Total Eggs
# 1        Dolly          9
# 2        Molly          7
As you can see, you can rename the column inside the dplyr group_by function.
Here is how to sum values by the group from multiple data frame columns. Notice that there are missing values in one of the columns, and the result looks like this.
df %>%
  group_by("Chicken Name" = Chicken) %>%
  summarise("Total Eggs" = sum(Eggs.laid),
            "Total Sales" = sum(Sales.in.EUR))

#  Chicken Name Total Eggs Total Sales
# 1        Dolly          9          NA
# 2        Molly          7          NA
If there are missing values and the data is correct, use an additional argument in the R sum function.
df %>%
  group_by("Chicken Name" = Chicken) %>%
  summarise("Total Eggs" = sum(Eggs.laid),
            "Total Sales" = sum(Sales.in.EUR, na.rm = TRUE))

#  Chicken Name Total Eggs Total Sales
# 1        Dolly          9         1.8
# 2        Molly          7         1.4
Sum across columns in R
If multiple columns are involved in the same type of calculation, you can use the function across. Here are plenty of other examples from this blog.
df %>%
  group_by("Chicken Name" = Chicken) %>%
  summarise(
    across(c(Eggs.laid, Sales.in.EUR), ~ sum(., na.rm = TRUE))) %>%
  rename("Total Eggs" = Eggs.laid, "Total Sales" = Sales.in.EUR)

#  Chicken Name Total Eggs Total Sales
# 1        Dolly          9         1.8
# 2        Molly          7         1.4
Sum by multiple groups
Here is how to do the same by using multiple grouping columns.
df %>%
  group_by("Chicken Name" = Chicken,
           Location.during.daytime) %>%
  summarise(
    across(c(Eggs.laid, Sales.in.EUR), ~ sum(., na.rm = TRUE))) %>%
  rename("Total Eggs" = Eggs.laid,
         "Location" = Location.during.daytime,
         "Total Sales" = Sales.in.EUR)

#  Chicken Name Location Total Eggs Total Sales
# 1        Dolly   Inside          5         1.0
# 2        Dolly  Outside          4         0.8
# 3        Molly   Inside          3         0.6
# 4        Molly  Outside          4         0.8
Summarise and keep the data frame ungrouped
Here is how to get the sum by the group in a separate column and keep data ungrouped.
df %>%
  group_by(Chicken) %>%
  mutate("Total Eggs" = sum(Eggs.laid)) %>%
  head() %>%
  print.data.frame()

#  Chicken Location.during.daytime Eggs.laid Sales.in.EUR Total Eggs
# 1   Molly                  Inside         0           NA          7
# 2   Molly                 Outside         1          0.2          7
# 3   Molly                 Outside         1          0.2          7
# 4   Molly                  Inside         1          0.2          7
# 5   Molly                  Inside         2          0.4          7
# 6   Molly                 Outside         2          0.4          7
If you have to calculate the sum involving conditions, you can apply filters from dplyr.
Calculate the sum by group in R using data.table
The advantage of calculations with the data.table is the speed.
Here is how to sum by group in the data.table and rename columns in the result.
require(data.table)

df <- as.data.table(df)

df[, list("Total Eggs" = sum(Eggs.laid)), by = list("Chicken Name" = Chicken)]

#   Chicken Total Eggs
# 1:   Molly          7
# 2:   Dolly          9
Here is how to sum multiple columns by group in data.table.
df[, list(
  "Total Eggs" = sum(Eggs.laid),
  "Total Sales" = sum(Sales.in.EUR, na.rm = TRUE)
), by = list("Chicken Name" = Chicken)]

#   Chicken Name Total Eggs Total Sales
# 1:        Molly          7         1.4
# 2:        Dolly          9         1.8
Sum by multiple groups in the data.table.
df[, list("Total Eggs" = sum(Eggs.laid)),
   by = list("Chicken Name" = Chicken, "Location" = Location.during.daytime)]

#   Chicken Name Location Total Eggs
# 1:        Molly   Inside          3
# 2:        Molly  Outside          4
# 3:        Dolly   Inside          5
# 4:        Dolly  Outside          4
Summarise by group in the base R
Here are a couple of similar situations and how to solve them in base R.
With the help of the function setNames, you can rename columns of the aggregate result.
setNames(aggregate(
  x = df$Eggs.laid,
  by = list(df$Chicken),
  FUN = sum
),
c("Chicken Name", "Total Eggs"))

#  Chicken Name Total Eggs
# 1        Dolly          9
# 2        Molly          7
In the function aggregate, you can sum multiple columns by the group.
setNames(
  aggregate(
    x = list(df$Eggs.laid, df$Sales.in.EUR),
    by = list(df$Chicken),
    FUN = sum,
    na.rm = TRUE
  ),
  c("Chicken Name", "Total Eggs", "Total Sales")
)

#  Chicken Name Total Eggs Total Sales
# 1        Dolly          9         1.8
# 2        Molly          7         1.4
Here is how to sum by multiple groups in base R.
setNames(
  aggregate(
    x = df$Eggs.laid,
    by = list(df$Chicken, df$Location.during.daytime),
    FUN = sum
  ),
  c("Chicken Name", "Location", "Total Eggs")
)

#  Chicken Name Location Total Eggs
# 1        Dolly   Inside          5
# 2        Molly   Inside          3
# 3        Dolly  Outside          4
# 4        Molly  Outside          4
Other useful posts from this blog
Learn how to calculate cumulative sum in R. Here is how to calculate the mean by group or percentage by group in R.
Leave a Reply