
If you have a line chart with a lot of series, it is time-consuming to format all of them separately. Here are a couple of approaches to quickly change the weight for all series in an Excel line chart or do another formatting. For example, change all series colors at once or change dash type.
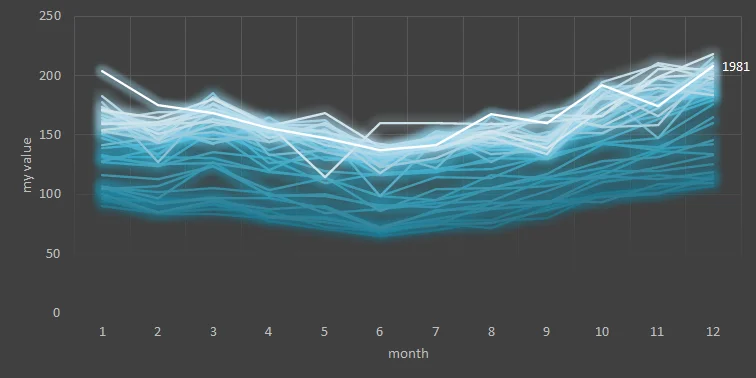
At this moment, there is no way to change the default series weight in the Excel line chart. Meanwhile, it might be helpful when dealing with a lot of series. Here is one of the scenarios with a glowing Excel line chart.
You can do something with all series in Excel chart by using color palettes and styles, but line width is too specific. Below are a couple of approaches you can use to format all data series in an Excel chart at once.
Use macros to change the weight of all series in an Excel line chart
A well-written macro is the best way to change all series weights in an Excel line chart at once. Below is the macro that changes the series width in the line chart from 2.25 pt to 1 pt. There is also error handling. Before running this macro, select the necessary Excel chart.
Sub ChangeSeriesWeights()

Dim MySeries As Series

On Error GoTo ErrorHandler

    For Each MySeries In ActiveChart.SeriesCollection

        MySeries.Format.Line.Weight = 1

    Next

Exit Sub

ErrorHandler: MsgBox "Please, select the chart before running this."

End Sub
Look at this post on how to add this macro to your Excel startup. It is possible to assign a shortcut to that. This post contains a macro for pasting only values and might be helpful.
You can record a macro with another formatting to repeat and add modifications to the previous one. For example, here is how to change all series colors at once.
Sub ChangeSeriesColor()

Dim MySeries As Series

On Error GoTo ErrorHandler

    For Each MySeries In ActiveChart.SeriesCollection

        With MySeries.Format.Line
        .Visible = msoTrue
        .ForeColor.ObjectThemeColor = msoThemeColorBackground1
        .ForeColor.TintAndShade = 0
        .ForeColor.Brightness = -0.150000006
        .Transparency = 0
        End With

    Next

Exit Sub

ErrorHandler: MsgBox "Please, select the chart before running this."

End Sub
Use F4 to copy the last formatting to other series
F4 is a shortcut used to repeat the last action in Excel. If you have to change all series weight in an Excel line chart rarely or there are a few series, F4 usage might be a rational solution.
- Select the first series in the Excel line chart, press Ctrl + 1, and change the line width.
- Use Ctrl and the up arrow to select the next series in the line chart.
- Press F4 to repeat the series width modifications.
Copy format from one chart to another in Excel
If you already have desired formatting in another Excel chart, you can use this simple trick to copy that.
Another approach is to change the series width in an Excel line chart with one series and apply formatting to another chart with multiple series. I found this approach limiting. In my case, Excel changed the series weight from 2.25 pt to 1.5 pt no matter what width I selected. If you want a 1.5 pt width, then it is good enough.
Use templates to change the weight for all series in Excel or recreate another formatting
If you are using many modifications in your Excel chart, try to save them as a template. That might be useful to apply them repeatedly. Here is an instruction from Microsoft that you guide you through chart template creation.
Leave a Reply