
Here is my approach on how to categorize numbers by user-defined groups with R. When you have a few predictable groups, you can use the ifelse function. But sometimes, there is a long list of numbers that are changing over time.
Categorize numbers with the plyr and dplyr
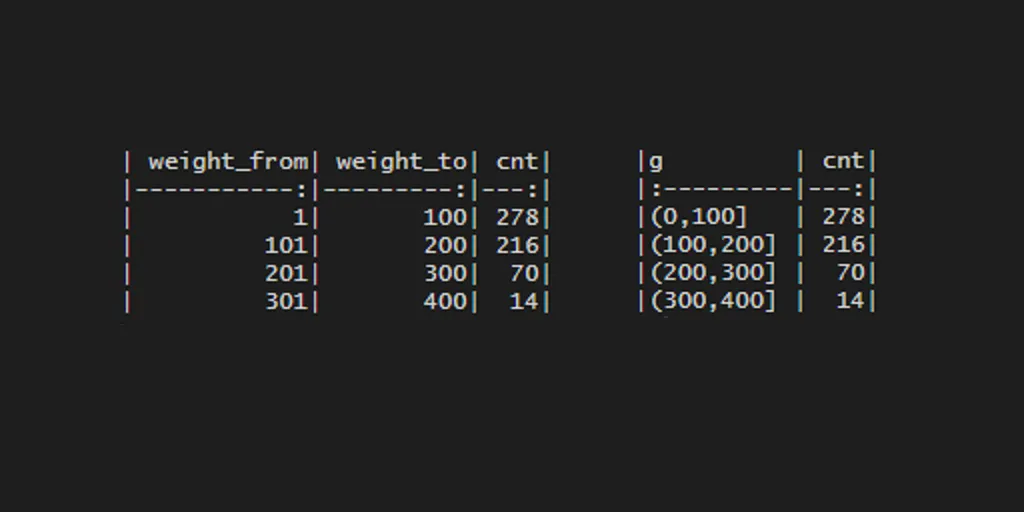
To categorize numbers, I will use R built-in dataset ChickWeight and R package plyr. There is a column called weight that I would like to categorize in groups by hundreds (1 to 100, 101 to 200, etc.).
cw <- ChickWeight

require(plyr)

cw$weight_from <- round_any(cw$weight - 1, 100, f = floor) + 1
cw$weight_to <- round_any(cw$weight, 100, f = ceiling)
If you have to get a count of each category’s value, then you can do that with dplyr like this.
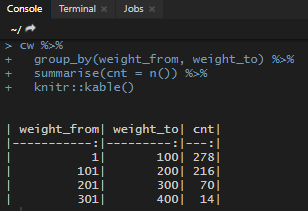
require(dplyr)

cw %>%
group_by(weight_from, weight_to) %>%
dplyr::summarise(cnt = n()) %>%
knitr::kable()

Be careful by using the plyr and dplyr together. It might cause a dplyr error if the function is referring to the wrong package.
Categorize numbers with dplyr
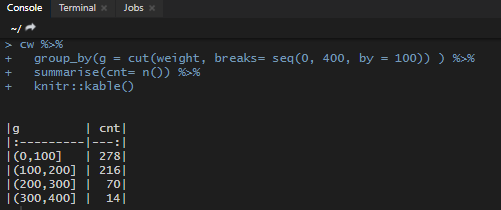
Of course, there are other ways to group numbers in R. For example, you can do that with the dplyr and cut function.
require(dplyr)

cw <- ChickWeight

cw %>%
group_by(g = cut(weight, breaks= seq(0, 400, by = 100)) ) %>%
dplyr::summarise(cnt= n()) %>%
knitr::kable()

Here is another approach with a cut function if you need to label your numbers.
Dplyr is one of the most popular packages in R. If you want to know more tips and tricks, please take a look at my favorite dplyr tips and tricks.
Check out my favorite RStudio tips and tricks.