One of the captivating features of ggplot2 is its ability to seamlessly merge data and design, creating visually impactful charts and graphs. While a uniform color scheme for data labels in ggplot2 stacked column charts might fall short, this post unveils a technique that not only introduces sophistication to your visualizations but also amplifies data interpretability. Let’s explore how this customization can elevate your ggplot2 stacked column chart data label colors, making them visually stunning.
Here is my fictional data set and some of the necessary R packages.
require(ggplot2)
require(colorspace)

animals <- data.frame(
  species = rep(c("Lion", "Elephant", "Giraffe", "Zebra"), each = 3),
  region = rep(c("Africa", "Asia", "Americas"), times = 4),
  population = c(5000, 2000, 1000, 3000, 8000, 1500, 400, 800, 1000, 500, 700, 400)
)
This is the first version of the ggplot2 stacked bar chart with reordered categories using total column value. It might be tricky to get the necessary category order. Look at this post and learn more about how to reorder the ggplot2 axis.
ggplot(animals, aes(
  x = reorder(species, population, FUN = sum, decreasing = TRUE),
  y = population,
  fill = region
)) +
  geom_bar(stat = "identity", width = 0.6) +
  geom_text(aes(label = population),
            position = position_stack(vjust = 0.5),
            size = 3) +
  labs(title = "Animal Population by Species and Region",
       x = "Species", y = "Population") +
  theme_minimal()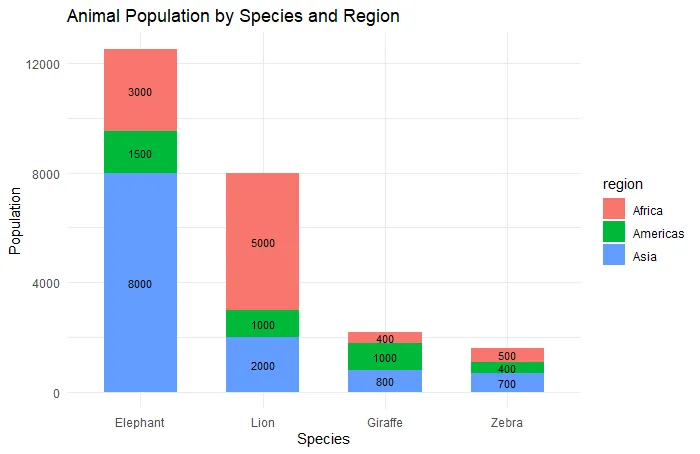
Here is another post where you can learn how to add and change the positions of ggplot2 data labels.
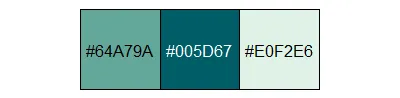
Customizing with Mint: Exploring Colorspace Color Palettes
I explored some of the color palettes from the colorspace package. The Mint color palette caught my eye.
hcl_palettes("sequential (multi-hue)", n = 3, plot = TRUE)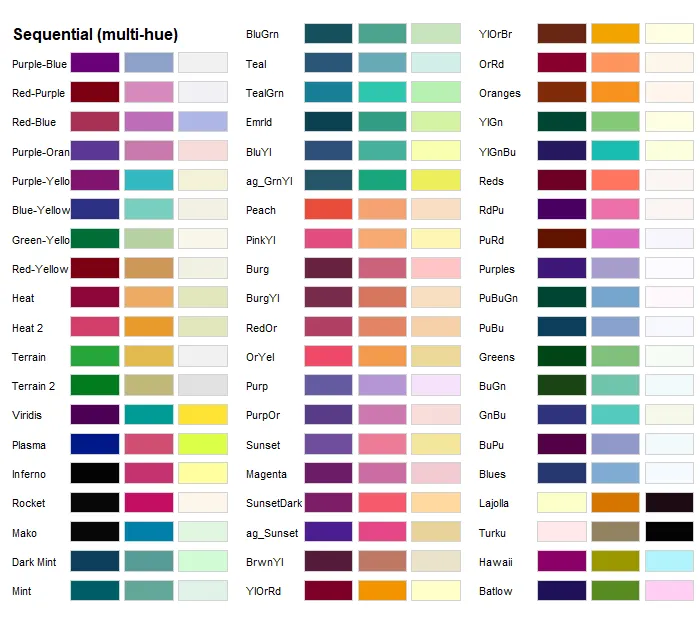
ggplot2 stacked column chart data label colors
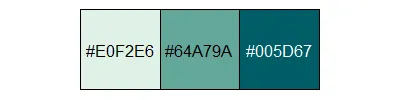
To get the necessary color sequence with the function rev in my plot, I reversed the color vector, and here is the result.
clr <- sequential_hcl(3, palette = "Mint")

clr <- rev(clr)

scales::show_col(clr, ncol = 3)
If you want to create your own sequence and plot the results, here is how to do that.
With manually changed colors, my ggplot2 plot looks like this.
ggplot(animals, aes(
  x = reorder(species, population, FUN = sum, decreasing = TRUE),
  y = population,
  fill = region
)) +
  geom_bar(stat = "identity", width = 0.6) +
  scale_fill_manual(values = clr) +
  geom_text(aes(label = population),
            position = position_stack(vjust = 0.5),
            size = 3.5) +
  labs(title = "Animal Population by Species and Region",
       x = "Species", y = "Population") +
  theme_minimal()
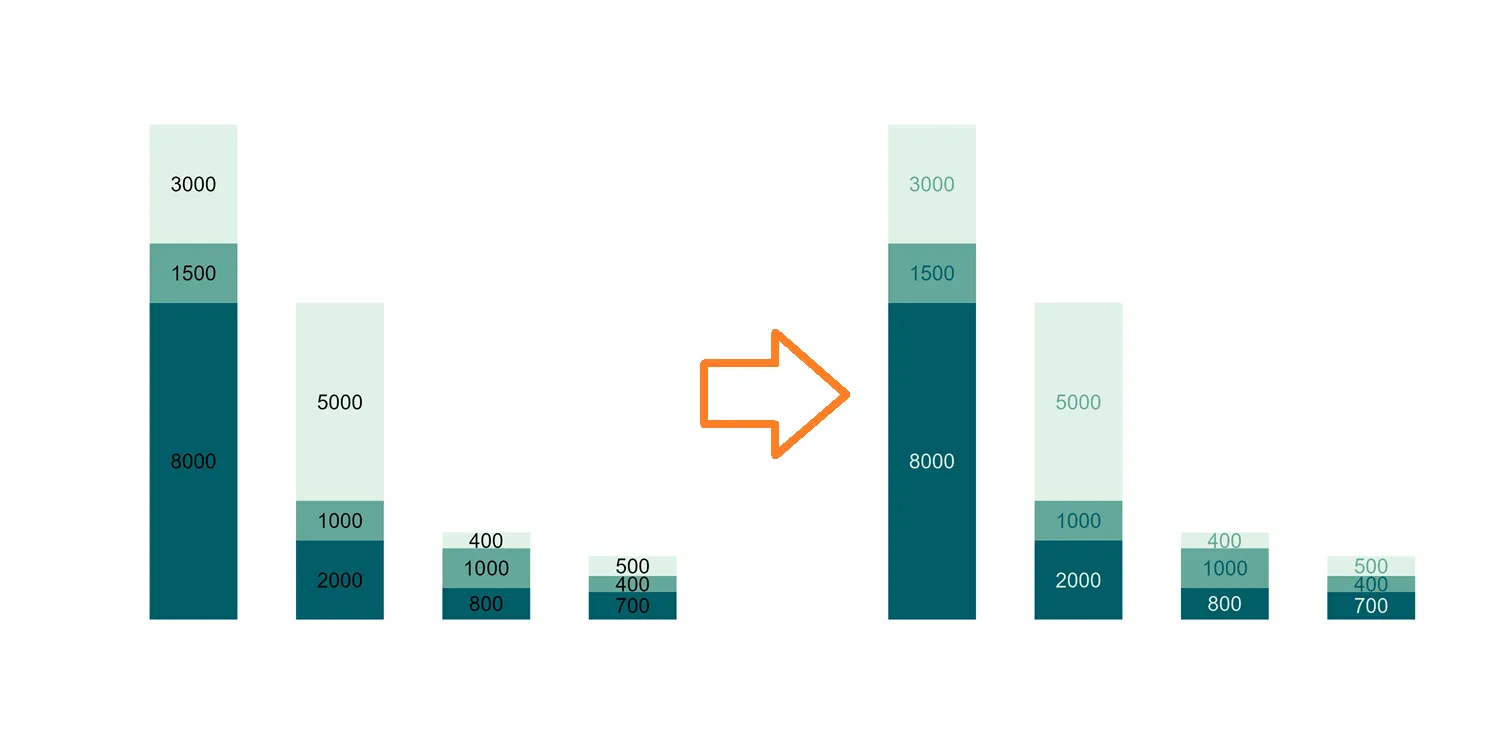
Data labels in the same color don’t really work, and here is how to fix that. You can use the same colors but in different order. Here is a shifted color vector by one position in R.
nxt_clr <- c(clr[-1], clr[1])

scales::show_col(nxt_clr, ncol = 3)
Here is how it looks in ggplot2 data label colors.
ggplot(animals, aes(
  x = reorder(species, population, FUN = sum, decreasing = TRUE),
  y = population,
  fill = region
)) +
  geom_bar(stat = "identity", width = 0.6) +
  scale_fill_manual(values = clr) +
  geom_text(
    aes(label = population, color = region),
    position = position_stack(vjust = 0.5),
    size = 3.5
  ) +
  scale_colour_manual(values = nxt_clr, guide = "none") +
  labs(title = "Animal Population by Species and Region",
       x = "Species", y = "Population") +
  theme_minimal()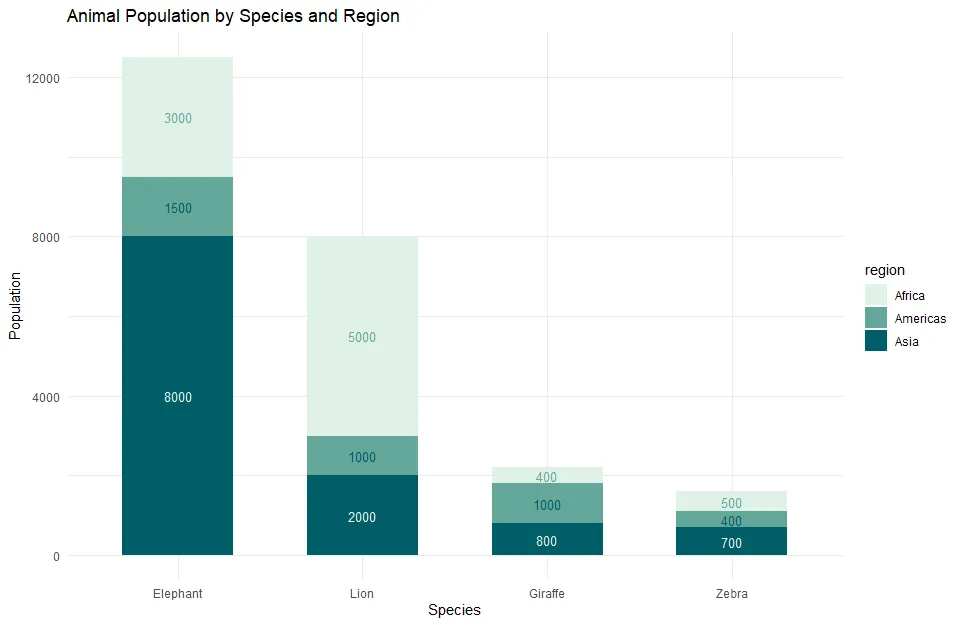
As you can see, that works well, and I can save time compared to reordering manually. In other situations, you can use the R function rev, or there might be an argument that can do that. For example, in the scale_color_discrete_qualitative from colorspace.
Leave a Reply