Category: R

How to combine Excel files in R, including transformations
Here are two quick solutions to combine Excel files in R with the necessary transformations. Fundamentally it is a similar approach that I used to combine multiple RDS files in R.
How to do something across columns in R using dplyr
If you know how to efficiently do calculations across columns in the R data frame it can save you a lot of time. One of the best ways to do that with data frames is by using the across function from dplyr.
How to get the weekday name from the date or number in R
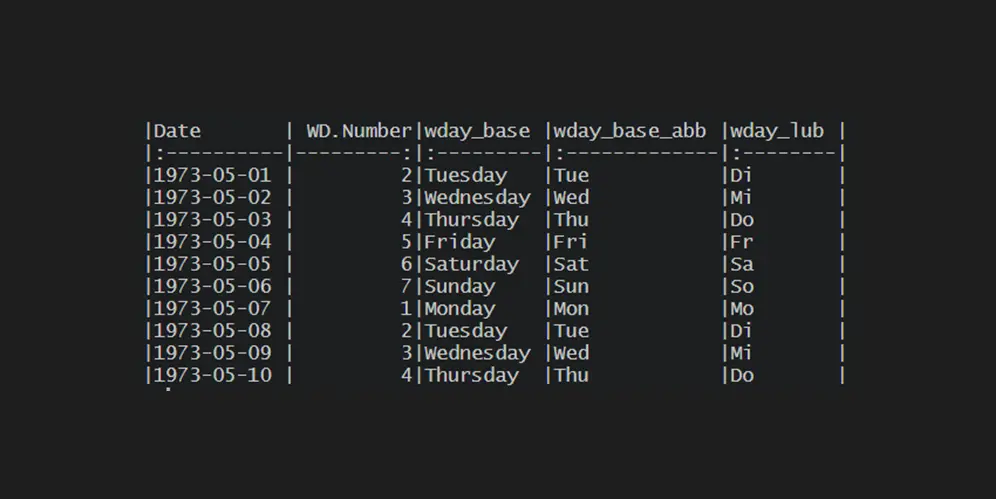
There are multiple scenarios where you would like to get the weekday name from the date or number in R. Here are four solutions to get that depending on available content. The weekday number might already be in a separate column or obtainable from the date. It is not so easy as getting the month…
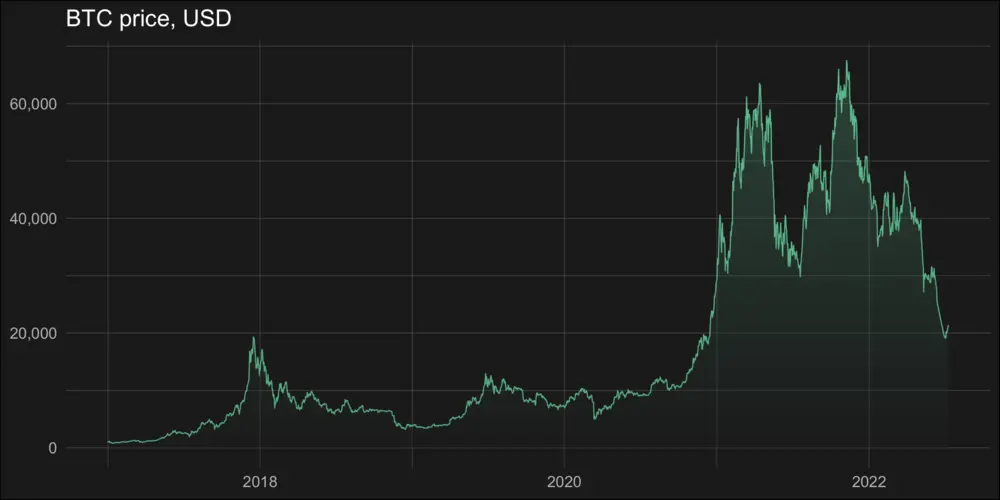
How to create gradient shade under the line chart in R
Here is how to create a vertical gradient shade under a line chart in R. It is a trickier task than using the gradient effect in a line chart or word cloud. Actually, it is a gradient area chart with accented line. In the beginning, I was looking at this from somehow a weird perspective.
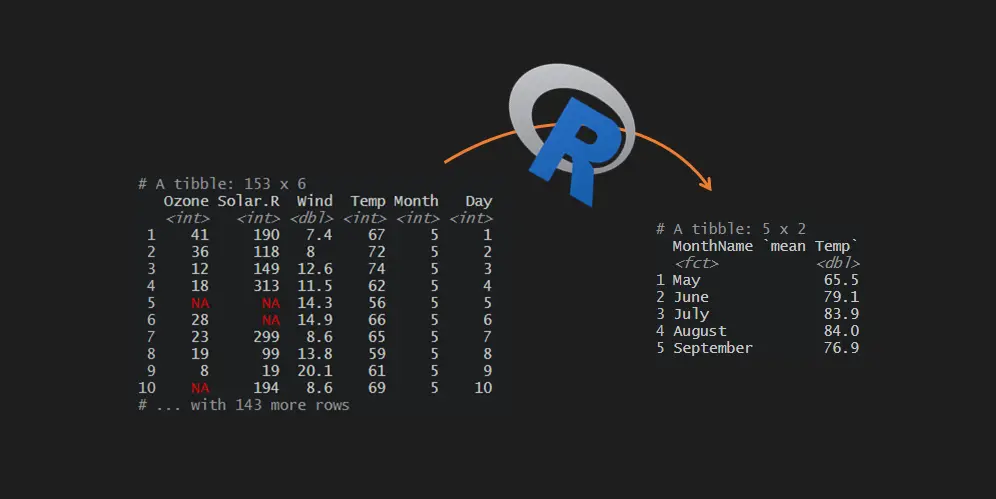
Mean by a group in R
Here is how to calculate the mean by a group in R. If you are an Excel, user you might prefer to say average by a group in R. This post contains multiple scenarios that will ensure that you know some of the pitfalls and tricks.
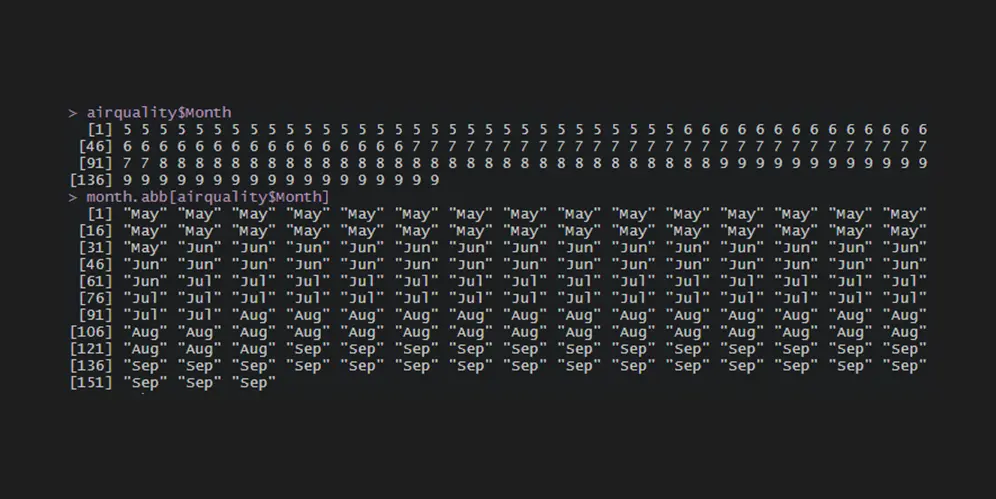
How to get the month name from the number in R
There are multiple scenarios where you would like to get the month name from the number in R. Here are two solutions to get that depending on the month number location. The month number might already be in a separate column or date.
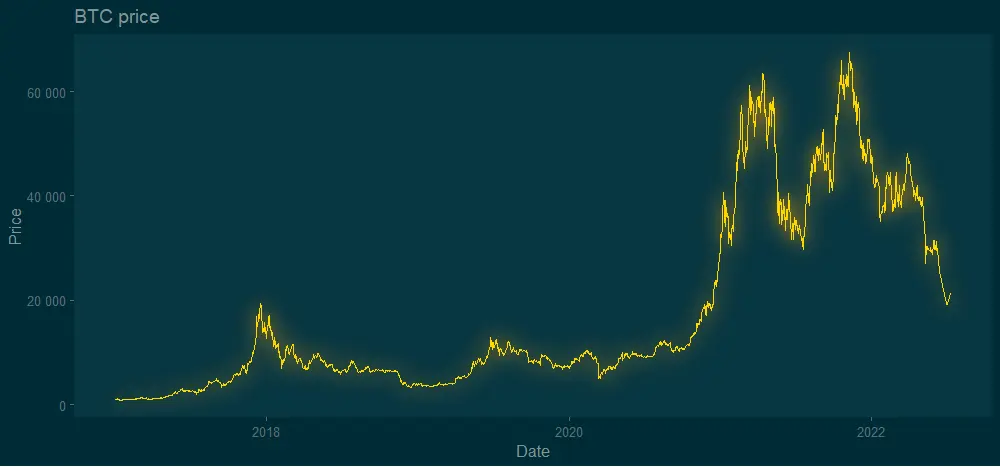
How to add glow effect in R plot
The glow effect in the R plot might be one of those adjustments that someone uses rarely. Meanwhile, neon luminescence adds a special feel to the diagram. Almost like from sci-fi movie. Here is how to add the glow effect in the R plot by using two solutions.
