Category: Power BI
How to create group index with Power Query or R
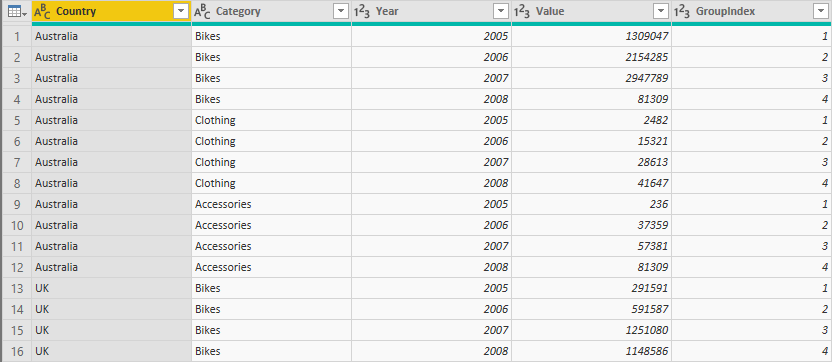
It is possible to generate a group index (unique row ids) by one or many groups in Power Query. It comes handy when you have to detect the first or last record in each group. Here is 2 solutions: group index with M language and group index with R.
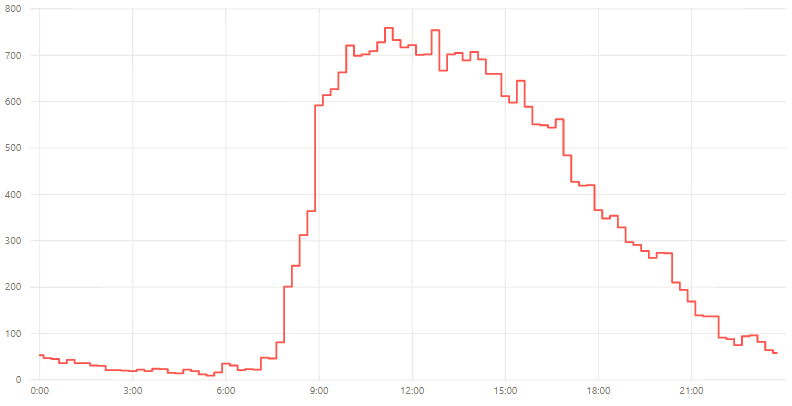
How to add markers to line chart in Power BI
Like step chart option previous post it is also a little bit hidden. The key is to use categorical X axis. After that, you can see activated marker option under Shapes.
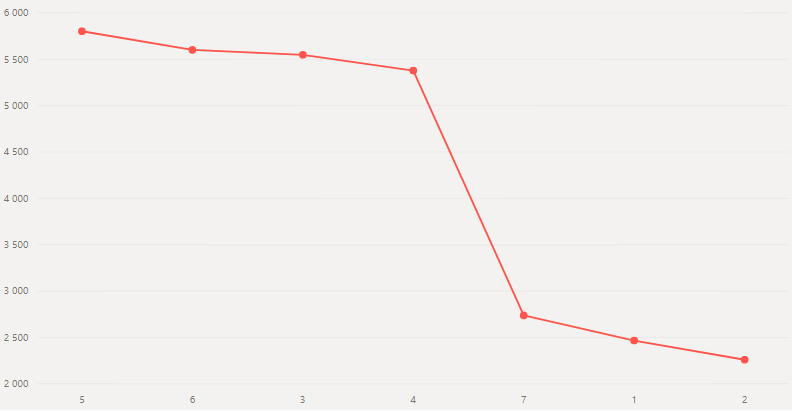
How to create a step chart in Power BI
It is a little bit hidden option, but very simple to use. After creating your line chart, go to the Format section -> Shapes -> turn on Stepped.

Easy way how to make Power BI table from scratch, without an external data source
There are two options: – Power Query function #table – Enter Data feature in Power BI #table function, in my opinion, is a more flexible way if you like to work with M code, but sometimes time-consuming. Here is a reusable solution to quickly build Power Query #table function in Excel with text concatenation.

How to calculate today’s date in Excel, VBA code in Excel, DAX, Power Query, R, PowerShell, CMD and SQL
No matter what kind of tool you use need to get today’s date remains. Here is how to do that in eight different environments.

How to get LiveChat API data with Microsoft Excel or Power BI
Here is an example with getting LiveChat transcripts right into Microsoft Excel Power Query or Power BI. Chat conversations are not the most convenient data what you can get through the API, because results are divided into pages, each containing 25 chats. So in the further post is a simple method of how to make…