
Here is my approach on how to make Microsoft Power BI line chart with accented last data point. It is flexible and can be used with filters.
Month: June 2020
dplyr error: column must have a unique name

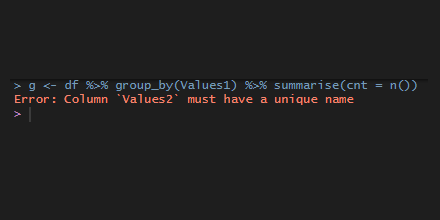
In rare cases, the data source may contain multiple columns with the same name, and some of the next actions with dplyr functions might result in the error “column must have unique name”.
How to rename data frame columns in R


Here are multiple ways how to rename columns in R using base functionality or dplyr functions like rename and select.
Difference between DAX and Excel functions that looks the same


If you know Excel functions, it is easier for you in Power BI with DAX. Sometimes it is mentioned as an advantage. It is indeed, but sometimes there is a significant difference between DAX and Excel functions that looks the same. I’m not talking about cell references – those are obvious.
R error in data.frame : undefined columns selected

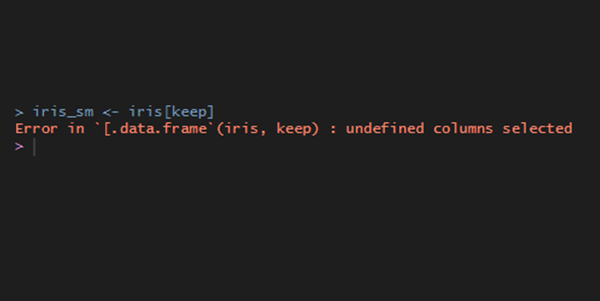
For me, R error undefined columns selected appears when I try to select some of the columns to keep in the data frame. It is easy to solve. You have to search for the misspelled column name, but if there is a long list of column names, then here is how to do that quickly.
Convert R TRUE and FALSE values to 1 and 0, and vice versa

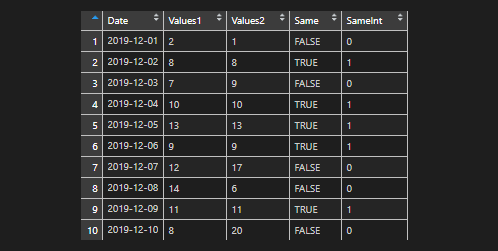
Here is a simple method to convert R TRUE and FALSE values to 1 and 0, and vice versa.
Convert TRUE and FALSE into 1 and 0 in Power BI

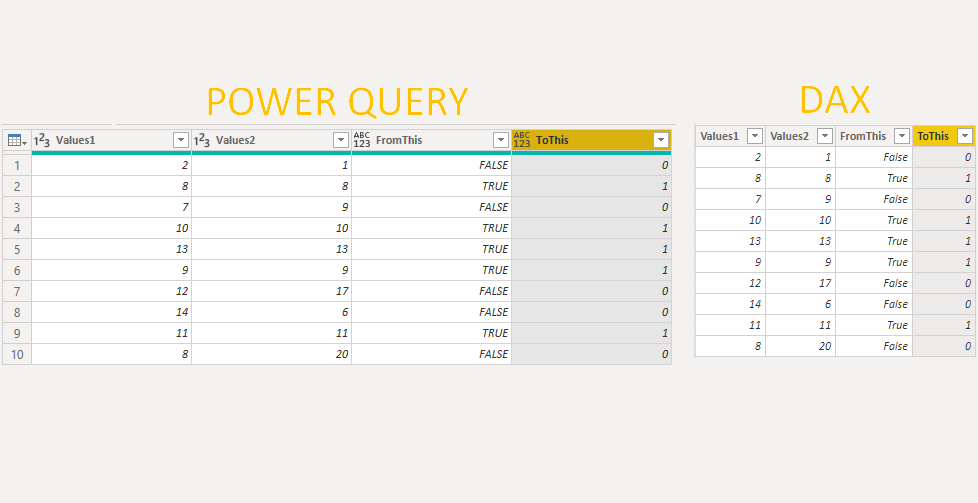
Here is a simple way how to convert TRUE and FALSE into 1 and 0 in Power BI. Precisely speaking – Power Query and DAX.
Convert TRUE and FALSE values to 1 and 0 in Excel


Here is a simple trick that is not so obvious. By adding two minus signs before calculation, you can convert TRUE, FALSE into 1, 0 in Excel. =–(A2=B2)
Auto-detect R data frame column data types

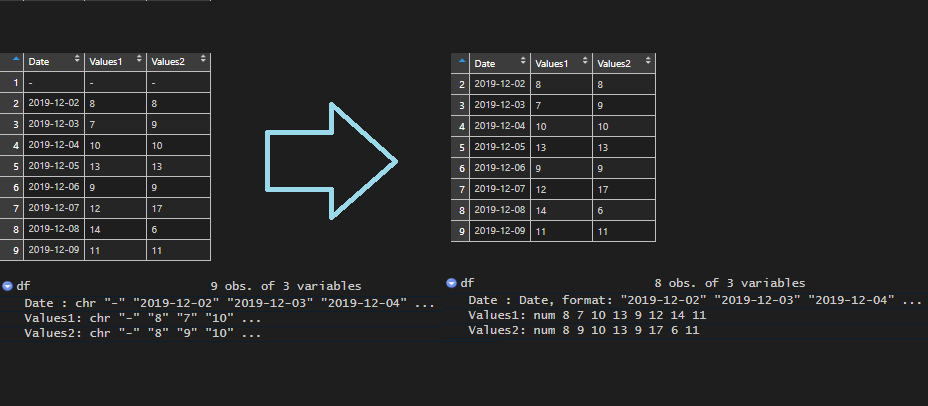
Here is how to auto-detect and change data types for multiple columns in R at the same time.
How to identify outliers in Microsoft Power BI

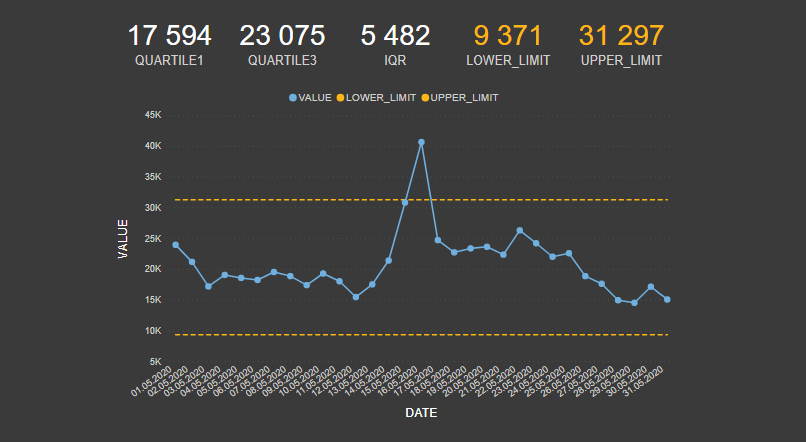
One of the simplest methods that you can detect outliers in Power BI is visual detection and IQR method that is also used in box plots (sometimes called box and whisker plot).