
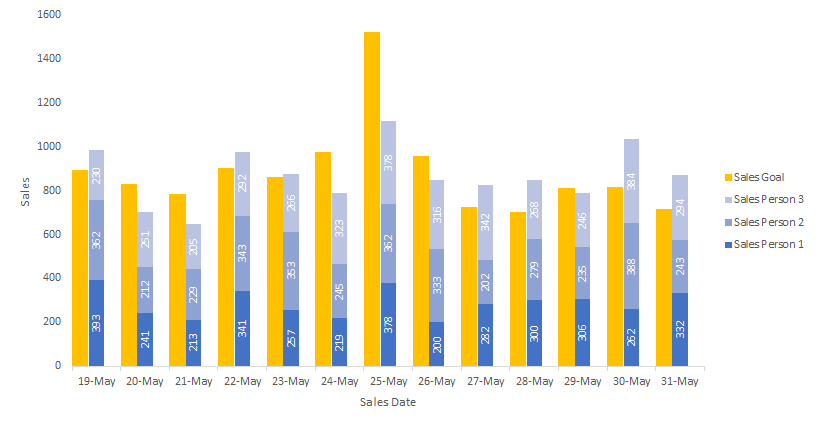
If you want to create an Excel chart that contains clustered columns and stacked columns altogether, this post is for you.
Month: May 2020
Multiple left joins in R

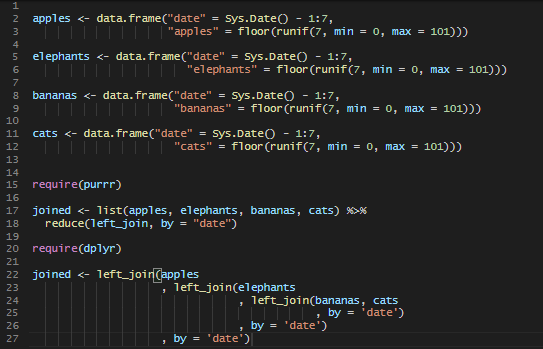
Here is a quick and easy way to perform multiple left joins in R with multiple data frames.
How to close EXCEL.EXE from Windows command line

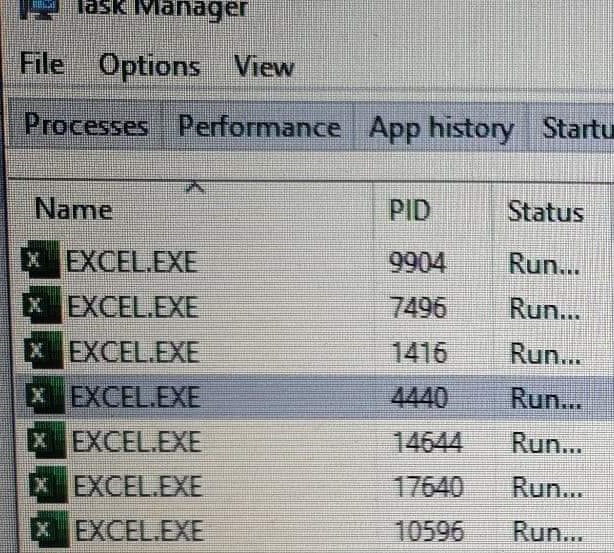
In the last days, I was running into a problem that even all Excel files are closed bunch of EXCEL.EXE processes still running. Here is how to close all EXCEL.EXE at once.
How to schedule batch file in Windows 10 Task Scheduler

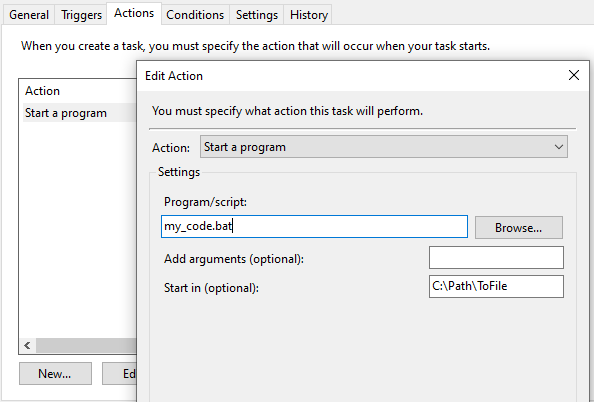
Here is how to schedule a batch file in Windows Task Scheduler.
How to run Windows batch file from R script
For me, it worked like this, but there is also modification needed in the actual batch file. system(“cmd.exe”, input = paste(‘C:\\This\\Is\\Path\\Your.bat’)) In the batch file, I added exit command at the end because that was running in an endless loop. On the other hand, endless loops with proper timing and conditions in the batch… Continue reading How to run Windows batch file from R script
How to convert accented characters to unaccented in R or Power BI

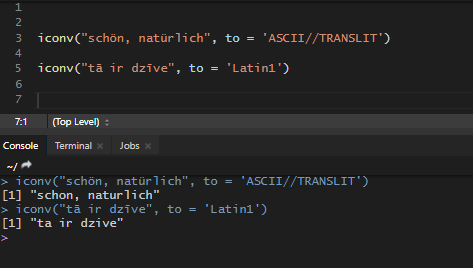
Sometimes it’s necessary to convert accented characters to non accented in R or Power BI for text analysis purposes. Accented characters might be a problem in texts with spelling mistakes and spoil the analysis.
Power BI line chart marker color conditional formatting

Even there is no straight forward option to build Power BI line chart marker color conditional formatting, you can do that, by using a bar chart formatting features.
How to concatenate text by group in R


To concatenate, you can use R base functions paste and paste0 that are almost the same. The only difference is in the separator argument. In this situation, we will use the collapse argument that will separate all the text within a group when concatenated.
How to get maximum or minimum value by each group in R

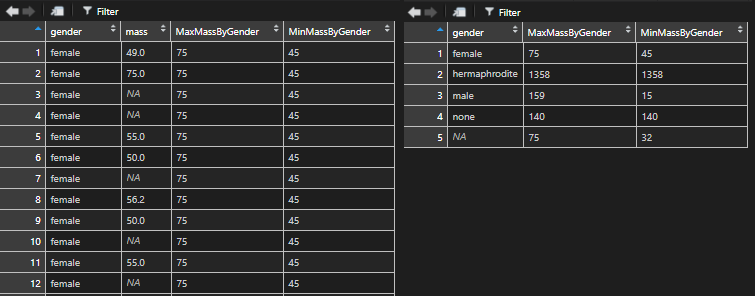
Here is a quick and easy way hot to get the maximum or minimum value within each group in R in separate columns. Let’s take a look at the data set with NA values, which makes it a little bit harder.