
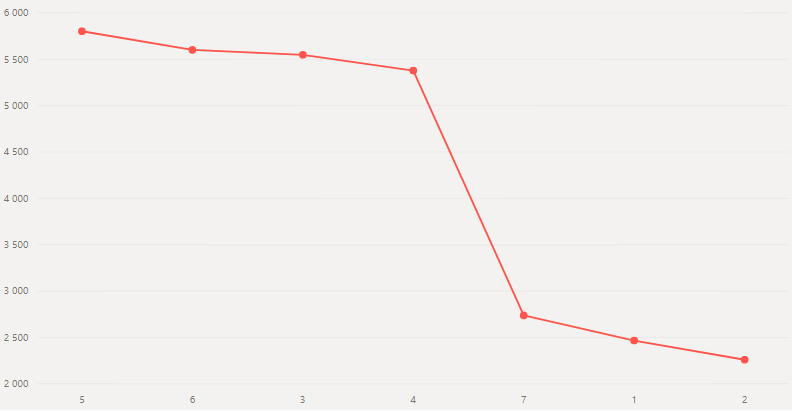
Like step chart option previous post it is also a little bit hidden. The key is to use categorical X axis. After that, you can see activated marker option under Shapes.
R programming, Excel, DAX, Power BI
Like step chart option previous post it is also a little bit hidden. The key is to use categorical X axis. After that, you can see activated marker option under Shapes.