Tag: ggplot2 vertical gradient line chart
How to create a gradient line chart in R
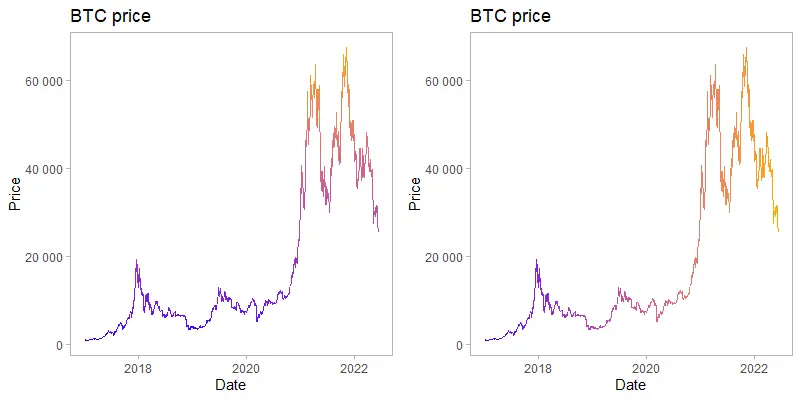
The gradient line chart in R is a little bit artistic approach to emphasize ups and downs or progression. A gradient line chart will be made with two directions of the color gradient using ggplot2. The first one will be vertical and the second horizontal.