Tag: ggplot2 heatmap na value
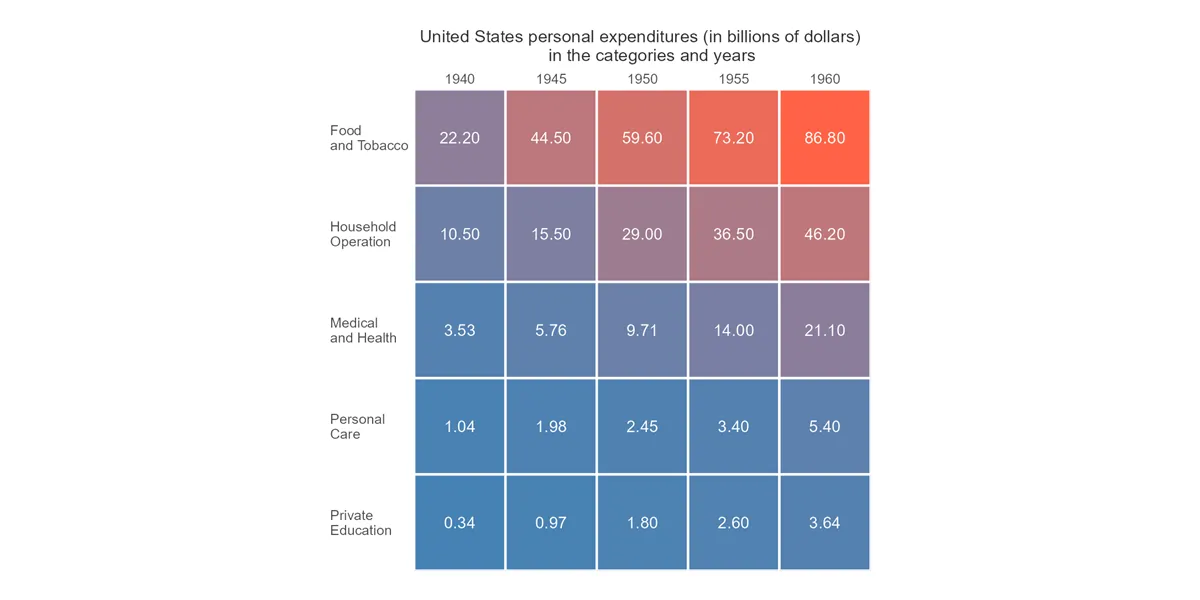
How to create a simple heatmap in R ggplot2
Here is how to quickly build a heatmap in R ggplot2 and add extra formatting by using a color gradient, data labels, reordering, or custom grid lines. There might be a problem if the data contains missing values. At the end of this post is an example of how to deal with NA values in…