Tag: Funnel plot in ggplot2
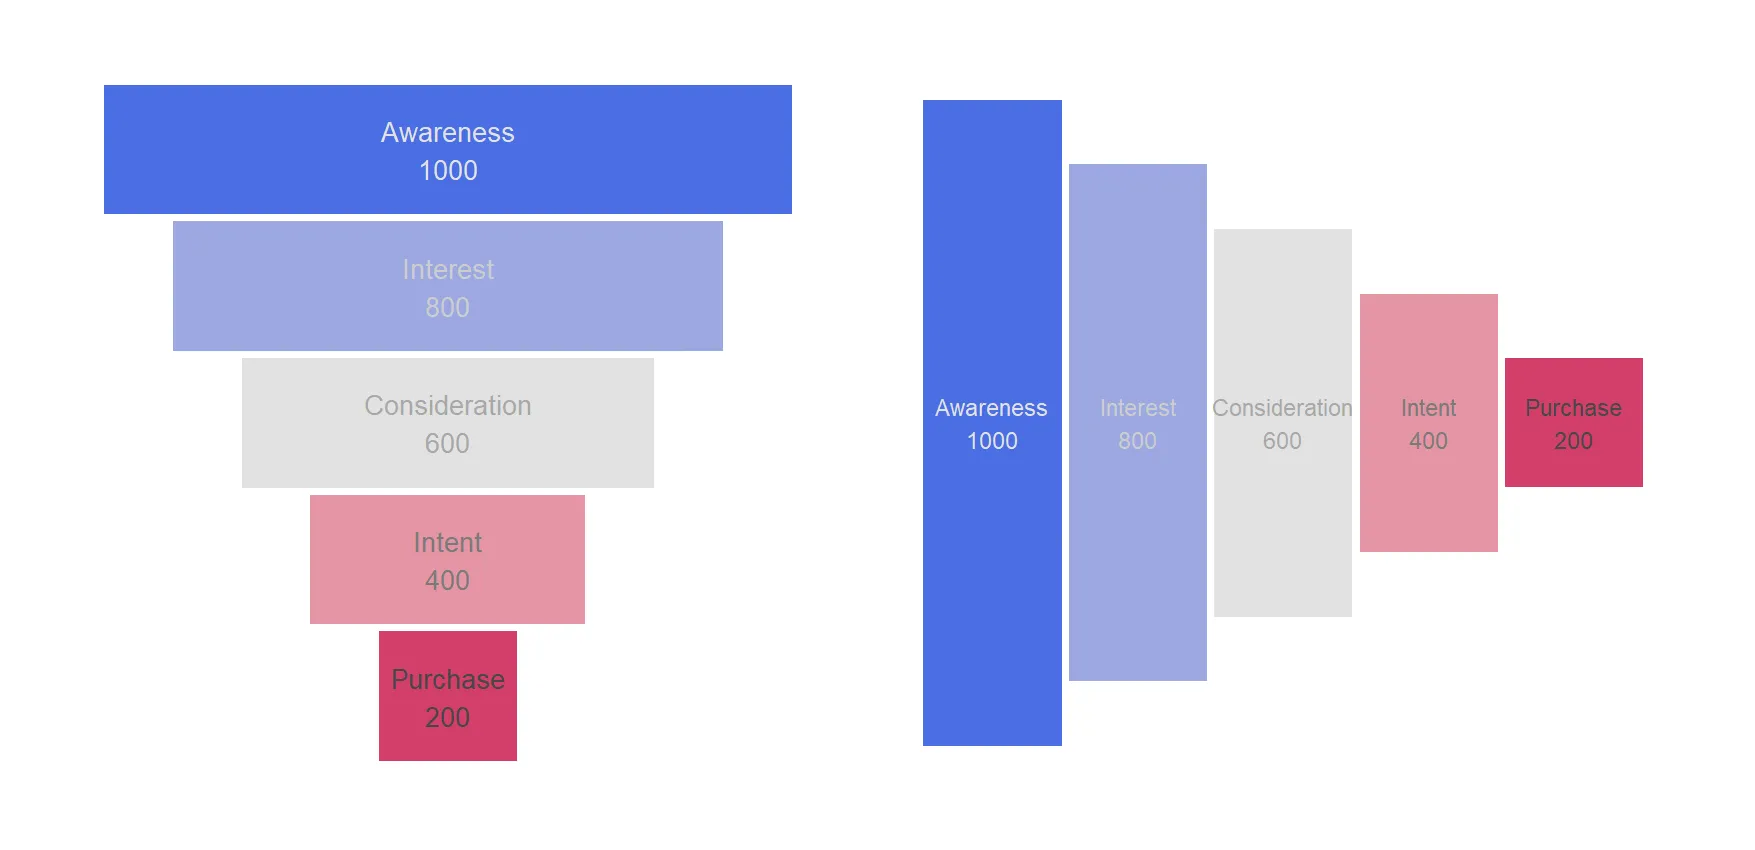
How to create a funnel chart in R using ggplot2
Here is the step-by-step process of creating a funnel chart in R with its versatile ggplot2 package. That allows us to craft visually appealing and informative funnel charts that can help you uncover insights, identify bottlenecks, and communicate the story of your data-driven processes. A funnel chart is a visualization tool that is particularly useful…