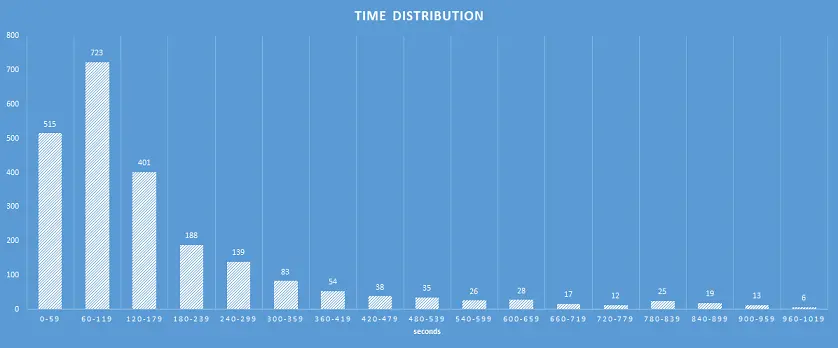
Histograms are useful for data distribution visualization, and there are many possible ways how to make an Excel PivotTable histogram. Some may prefer the Histogram option in Data Analysis Add-In or the FREQUENCY function for this task. But I think that the easiest way is to do that with PivotTable. Here is how to do… Continue reading Probably simplest and fastest way how to make a histogram in Excel
