Color picker for Power BI or Excel
At this moment, there is no built-in color picker in Power BI or Excel, but here is how to use eyedropper PowerPoint. Eyedropper in PowerPoint is capable of detecting RGB and Hex color codes.

Restart program with Windows command line
Here is an easy way to restart a program with the Windows command line by using the Windows command script. In this situation, I will create a script to restart Outlook minimized. There might be other specific needs, and some of them are in this post.
in

Detect combination of multiple strings in R
Here is how to detect multiple strings in R using base function grepl and alternatives, like str_detect from package stringr. There will be two main scenarios – detection of multiple strings simultaneously and any of the given strings.
in
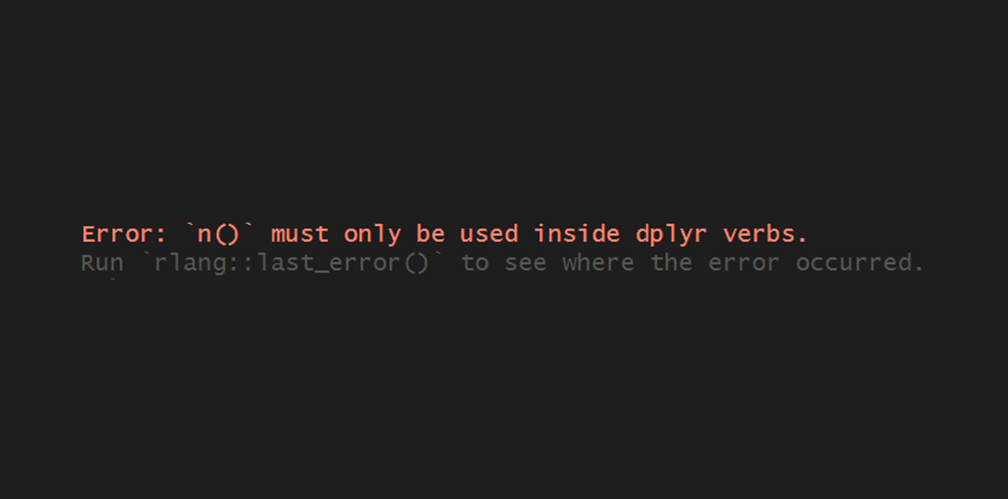
dplyr error: `n()` must only be used inside dplyr verbs
If you are using R and getting dplyr error: `n()` must only be used inside dplyr verbs, then here is the most likely cause and 3 possible solutions to this problem.
in
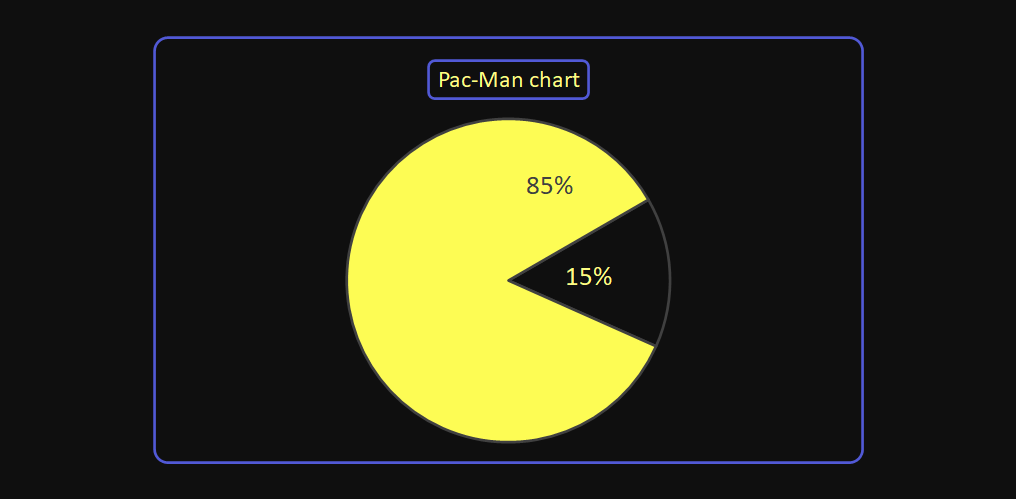
Pac-Man (two slice pie) chart in Excel, rotate Excel pie chart slice
If your data contains two categories, don’t miss a chance to create a Pac-Man chart in Excel. It might not work all the time, but if one category is between 15-25%, then your two slice pie chart might be looking similar to famous gaming hero Pac-Man. There might be several creations in the process of…

Recode data in R, replace values
Here is how to recode data in R in 3 different ways. Some may call it an efficient way how to replace existing values with new values.
in

My top 10 favorite dplyr tips and tricks
Here is a compilation of my favorite dplyr tips and tricks that are very useful and easy to learn. When I started to work with the dplyr package, the first thing was the shortcut for the pipe operator in Windows Ctrl + Shift + M. A little thing with a significant impact. That is why…

Round, roundup, rounddown, trunc in R
Here is how to round or truncate numbers, dates, and times in R in different ways. Depending on your goals and situation, there might be different needs and efficient solutions.
in
5 ways how to format output in R console
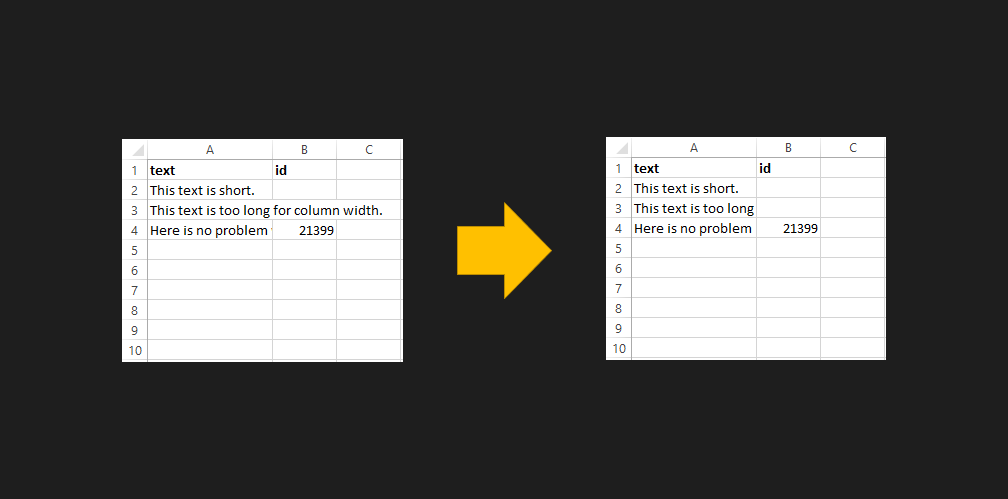
Here is how to format output in the R console in 5 different ways to make your dataset look better if that’s necessary. In my case, I like to take a quick look at few lines of a data frame and want to add gridlines or other formatting features to make them easier to read.
in