Here is how to add and modify the plot title in R using ggplot2 in many ways. After adding the ggplot2 title and subtitle, you might want to change the alignment, color, and size, add a bold effect to all or a few words, and do other customizations. Here are multiple examples of that.
How to add title and subtitle to R plot
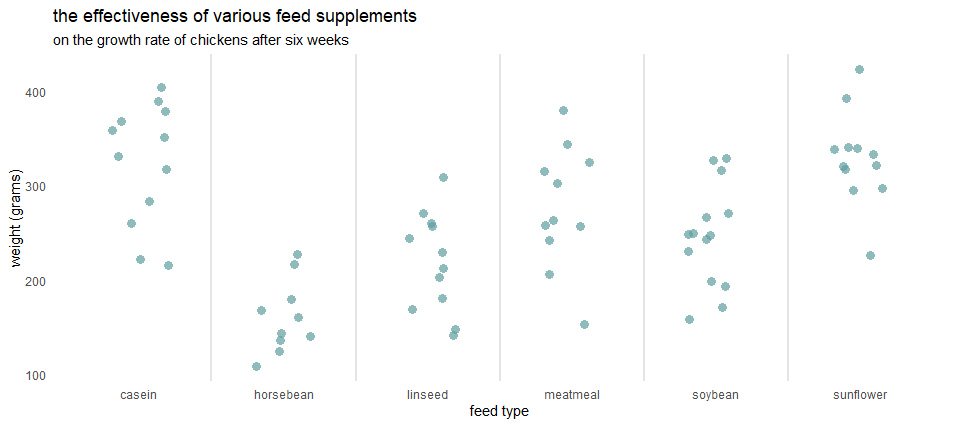
The best way for me to add a title and subtitle using the ggplot2 package is by using labs. Here is a jitter plot that contains the title, subtitle, and axis labels.
require(ggplot2)

set.seed(123)

ggplot(chickwts, aes(x = feed, y = weight)) +
  geom_jitter(
    size = 3,
    alpha = 0.7,
    shape = 16,
    width = 0.2,
    color = "cadetblue") +
  geom_vline(
    xintercept = seq(1.5, length(unique(chickwts$feed)), by = 1),
    color = "gray90",
    size = 1) +
  labs(
    title = "the effectiveness of various feed supplements",
    subtitle = "on the growth rate of chickens after six weeks",
    x = "feed type",
    y = "weight (grams)") +
  theme_minimal() +
  theme(panel.grid = element_blank())
Alternatively, you can use the ggtitle function, and sometimes it might be more compact, but by using that, you can not get as much as with labs.
Here is how to get the plot title and subtitle in R base.
Multilevel plot title in R
If you have a long ggplot2 title, you can split that into multiple lines. The easiest way is by using a new line character.
\n
set.seed(123)

ggplot(chickwts, aes(x = feed, y = weight)) +
  geom_jitter(
    size = 3,
    alpha = 0.7,
    shape = 16,
    width = 0.2,
    color = "cadetblue") +
  geom_vline(
    xintercept = seq(1.5, length(unique(chickwts$feed)), by = 1),
    color = "gray90",
    size = 1) +
  labs(
    title = "the effectiveness \nof various feed supplements",
    subtitle = "on the growth rate of chickens after six weeks",
    x = "feed type",
    y = "weight (grams)") +
  theme_minimal() +
  theme(panel.grid = element_blank())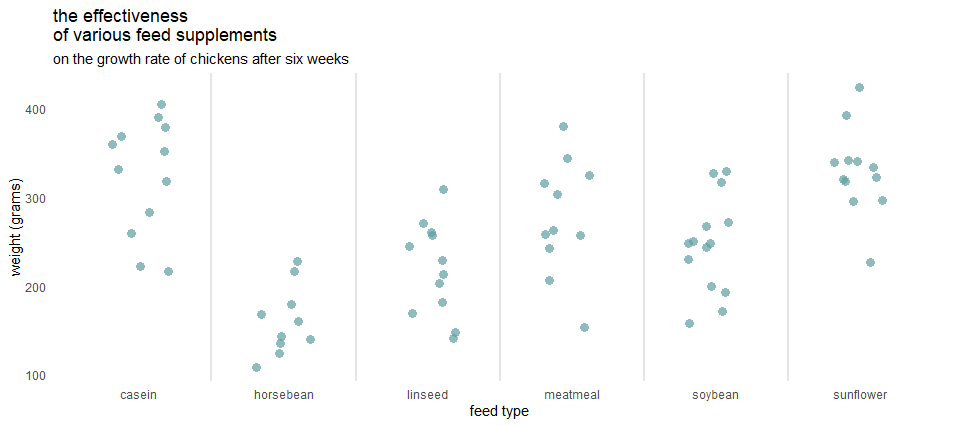
If the plot title in R is too long and you cannot decide how to break that, it might look as bad as this.
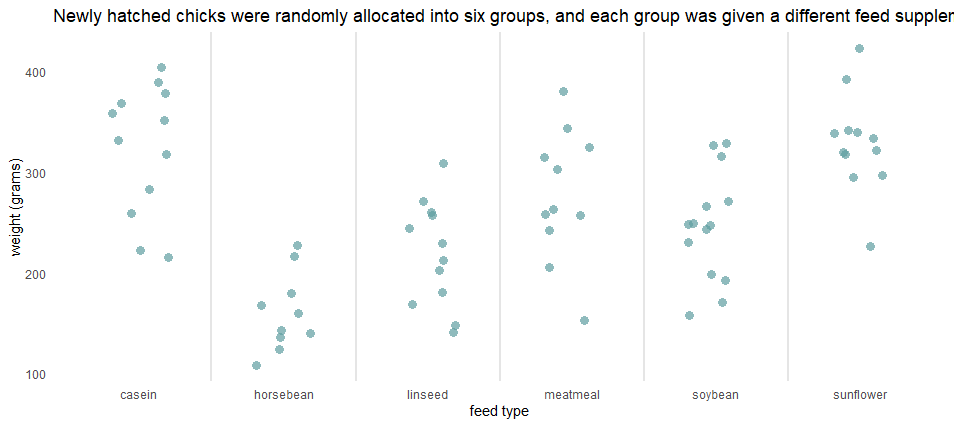
Try wrap_text from stringr and arrange ggplot2 title in several lines.
set.seed(123)

ggplot(chickwts, aes(x = feed, y = weight)) +
  geom_jitter(
    size = 3,
    alpha = 0.7,
    shape = 16,
    width = 0.2,
    color = "cadetblue") +
  geom_vline(
    xintercept = seq(1.5, length(unique(chickwts$feed)), by = 1),
    color = "gray90",
    size = 1) +
  labs(
    title = stringr::str_wrap("Newly hatched chicks were randomly allocated into six groups, and each group was given a different feed supplement. Their weights in grams after six weeks are given along with feed types."),
    x = "feed type",
    y = "weight (grams)") +
  theme_minimal() +
  theme(panel.grid = element_blank())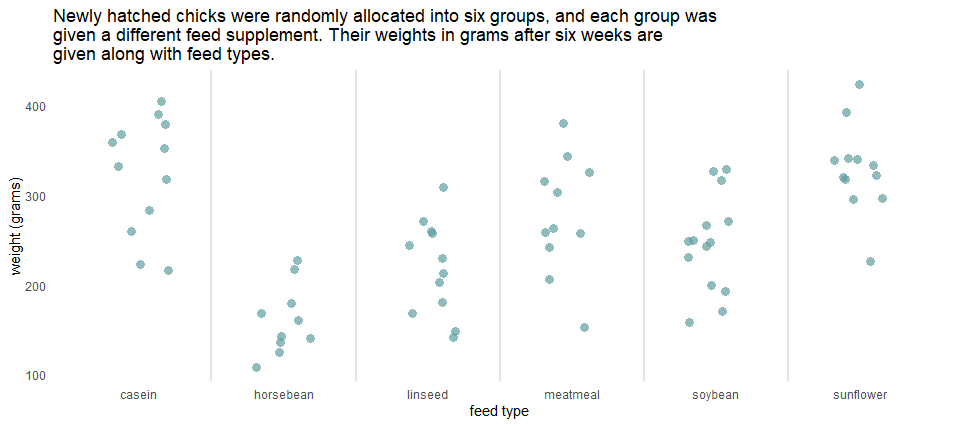
Change position and alignment of plot title in R
You can modify the position of the title or subtitle by using theme components plot.title, and plot.subtitle. Here is how to move them to the center of the plot by using the hjust argument.
set.seed(123)

ggplot(chickwts, aes(x = feed, y = weight)) +
  geom_jitter(
    size = 3,
    alpha = 0.7,
    shape = 16,
    width = 0.2,
    color = "cadetblue") +
  geom_vline(
    xintercept = seq(1.5, length(unique(chickwts$feed)), by = 1),
    color = "gray90",
    size = 1) +
  labs(
    title = "the effectiveness of various feed supplements",
    subtitle = "on the growth rate of chickens after six weeks",
    x = "feed type",
    y = "weight (grams)") +
  theme_minimal() +
  theme(panel.grid = element_blank()
        , plot.title = element_text(hjust = 0.5)
        , plot.subtitle = element_text(hjust = 0.5))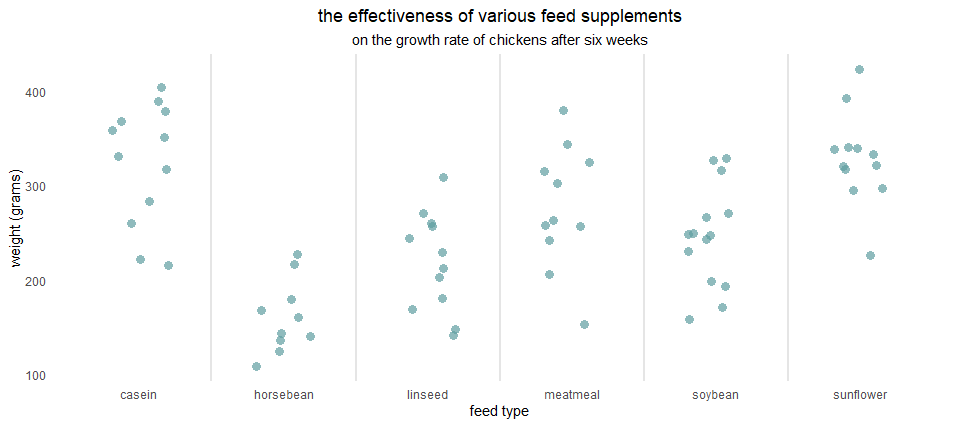
You can put the ggplot2 plot title inside the plot area by using the vjust argument.
set.seed(123)

ggplot(chickwts, aes(x = feed, y = weight)) +
  geom_jitter(
    size = 3,
    alpha = 0.7,
    shape = 16,
    width = 0.2,
    color = "cadetblue") +
  labs(
    title = "the effectiveness of various feed supplements",
    subtitle = "on the growth rate of chickens after six weeks",
    x = "feed type",
    y = "weight (grams)") +
  theme_minimal() +
  theme(panel.grid = element_blank()
        , plot.title = element_text(hjust = 0.5, vjust = -8)
        , plot.subtitle = element_text(hjust = 0.5, vjust = -10))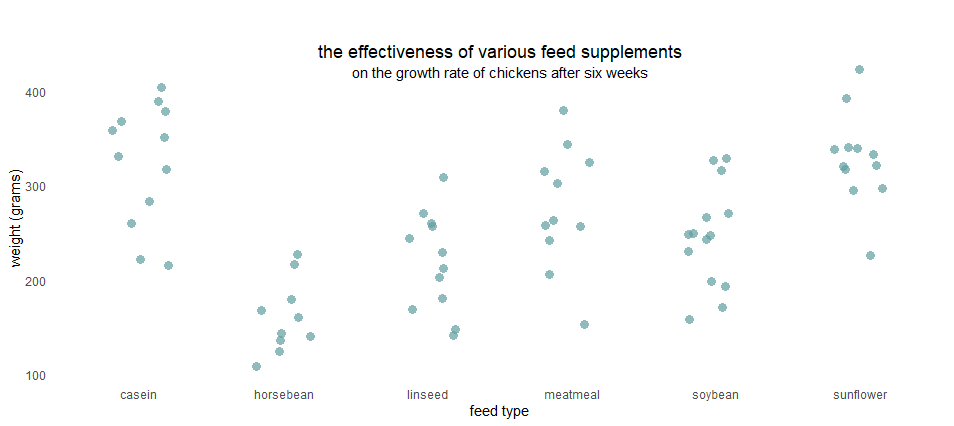
Another way to move the ggplot2 title inside the plot is by playing around with the margins.
set.seed(123)

ggplot(chickwts, aes(x = feed, y = weight)) +
  geom_jitter(
    size = 3,
    alpha = 0.7,
    shape = 16,
    width = 0.2,
    color = "cadetblue") +
  labs(
    title = "the effectiveness of various feed supplements",
    subtitle = "on the growth rate of chickens after six weeks",
    x = "feed type",
    y = "weight (grams)") +
  theme_minimal() +
  theme(panel.grid = element_blank()
        , plot.title = element_text(hjust = 0.5, margin = margin(t = 0, b = -30))
        , plot.subtitle = element_text(hjust = 0.5, margin = margin(t = 35, b = -30)))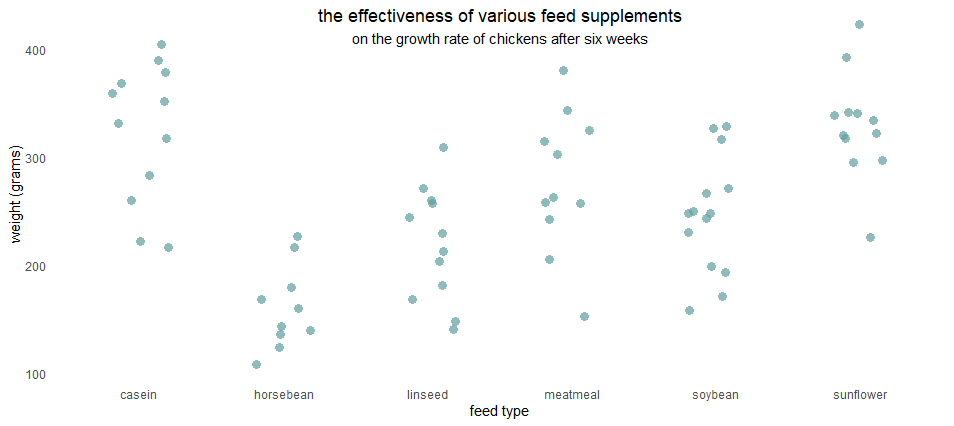
Change ggplot2 plot title font color and size
If you want to change the font color or size of the plot title in R ggplot2, you can do that in the theme.
set.seed(123)

ggplot(chickwts, aes(x = feed, y = weight)) +
  geom_jitter(
    size = 3,
    alpha = 0.7,
    shape = 16,
    width = 0.2,
    color = "cadetblue") +
  geom_vline(
    xintercept = seq(1.5, length(unique(chickwts$feed)), by = 1),
    color = "gray90",
    size = 1) +
  labs(
    title = "the effectiveness of various feed supplements",
    subtitle = "on the growth rate of chickens after six weeks",
    x = "feed type",
    y = "weight (grams)") +
  theme_minimal() +
  theme(panel.grid = element_blank()
        , plot.title = element_text(hjust = 0.5, color = "cadetblue", face = "bold", size = 15)
        , plot.subtitle = element_text(hjust = 0.5))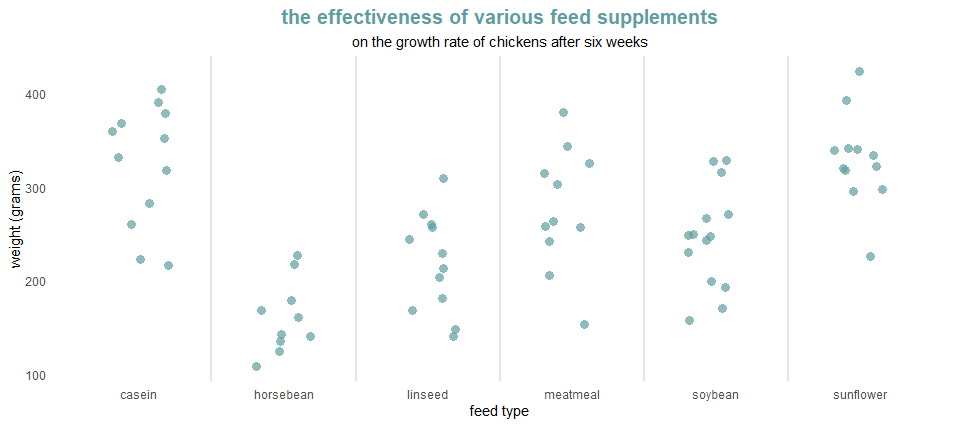
If you want to use bold or italic for separate words in the plot title, you can use the ggtext package and markdown.
require(ggtext)

set.seed(123)

ggplot(chickwts, aes(x = feed, y = weight)) +
  geom_jitter(
    size = 3,
    alpha = 0.7,
    shape = 16,
    width = 0.2,
    color = "cadetblue") +
  geom_vline(
    xintercept = seq(1.5, length(unique(chickwts$feed)), by = 1),
    color = "gray90",
    size = 1) +
  labs(
    title = "the effectiveness of various feed **supplements**",
    subtitle = "*on the growth rate of chickens* ***after six weeks***",
    x = "feed type",
    y = "weight (grams)") +
  theme_minimal() +
  theme(panel.grid = element_blank()
        , plot.title = element_markdown(hjust = 0.5)
        , plot.subtitle = element_markdown(hjust = 0.5))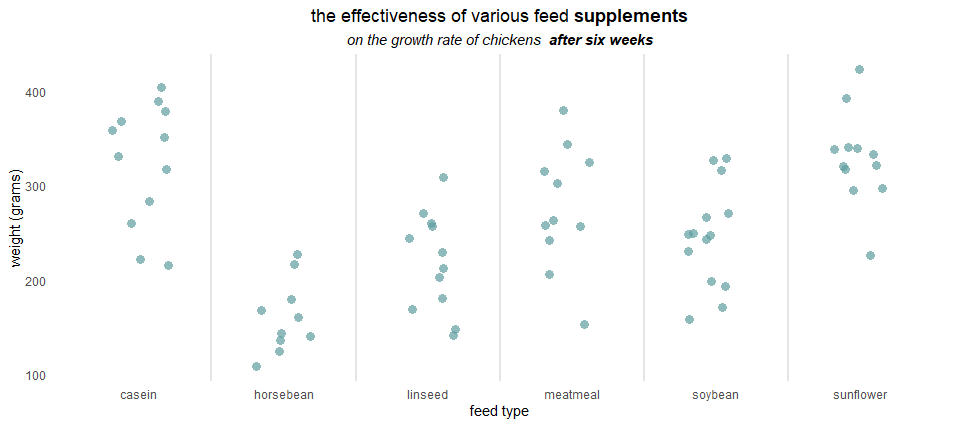
Use multiple colors in the ggplot2 plot title
You can use multiple colors in the ggplot2 title with the ggtext package.
In some situations, it is a way to substitute legend. Here is an example of that, but if you want to know more, look at this other post from this blog.
set.seed(123)

ggplot(chickwts, aes(x = feed, y = weight)) +
  geom_jitter(
    size = 3,
    alpha = 0.7,
    shape = 16,
    width = 0.2,
    color = "cadetblue") +
  geom_vline(
    xintercept = seq(1.5, length(unique(chickwts$feed)), by = 1),
    color = "gray90",
    size = 1) +
  labs(
    title = "the effectiveness of <span style = 'color:tomato;'>various feed </span>supplements",
    subtitle = "on the growth rate of chickens after six weeks",
    x = "feed type",
    y = "weight (grams)") +
  theme_minimal() +
  theme(panel.grid = element_blank()
        , plot.title = element_markdown(hjust = 0.5)
        , plot.subtitle = element_markdown(hjust = 0.5))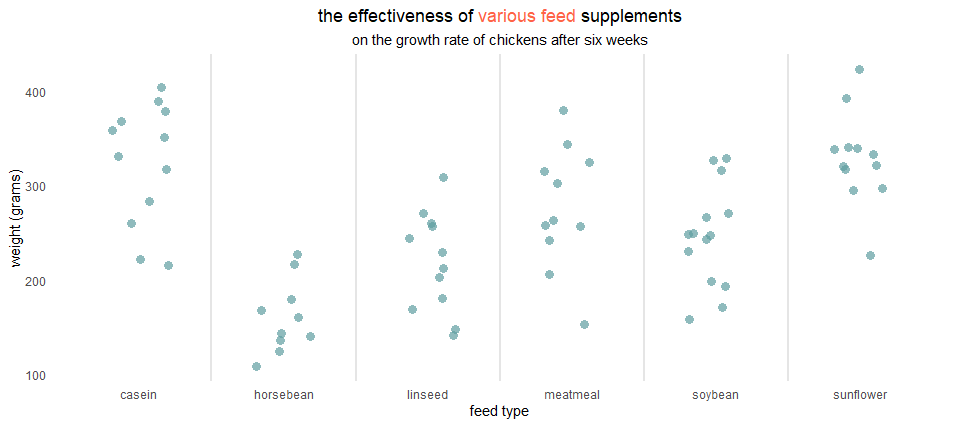
Leave a Reply