Here is how to create a simple near real time Power BI dashboard that will work without extra costs or complicated authorization. The hardest part is to get the data often enough. But if you are familiar with programming languages like R or Python, or other tools that can run from the Windows command line and get the necessary data, you are well prepared.
First of all, figure out how you will export the necessary data for this dashboard. It is great if you can do that with R, because:
- You can run the R script from the Windows command prompt.
- You can run the R script periodically by using a batch file.
With R it is relatively easy to connect to a variety of data sources because there are multiple great packages. If you are an experienced Excel user then here is a suggestion on how to use your Excel experience to learn R.
Also, Python or Windows SQL Studio with the sqlcmd utility or other tools could do the data export.
The data structure should be prepared as much as possible because you can not do extra modifications with Power Query.
Here is how to create a near real time dashboard in Power BI in a few steps
1. Create a new dashboard or use an existing one. Go to Edit and choose to Add a Tile.

2. Find and click on Custom Streaming Data, choose Next.
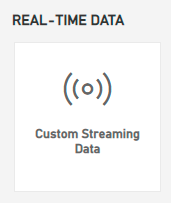
3. Choose to add a streaming dataset.

4. Choose API and click Next.
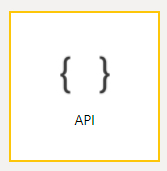
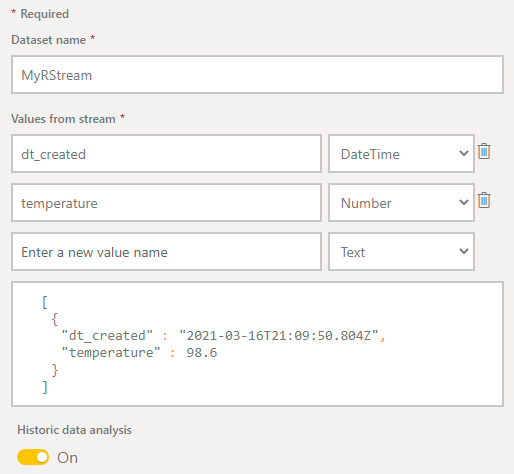
5. Now you should give a name to this dataset and do some planning – what kind of data and how you will stream. You should turn on Historic data analysis if you want to show data as a line chart that dynamically changes. When it is done click Create button.
6. New you will see the necessary script to push data to PowerBI. Switch to the PowerShell tab and copy all the code.
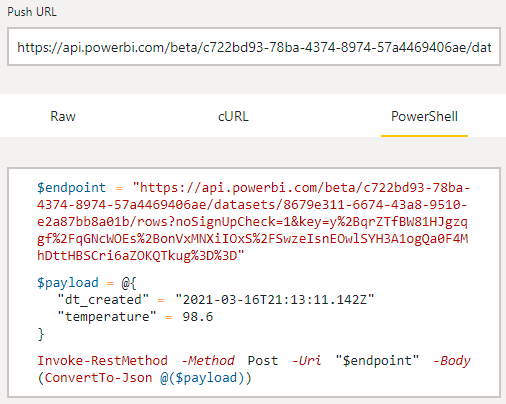
7. Open Powershell ISE and paste this code into the new PowerShell script.

8. Some of the modifications are needed. For example, you can add a timestamp with the actual date time when the script is executed. You should also read the necessary data and assign it to the necessary variables. Before that test your PowerShell script by running it.

9. Go to the Power BI and add tile again like in the first step. Choose CustomStreaming Dataset and now you will see that you have one.

10. After choosing that you will see that you can create some visualizations for this streaming data set.
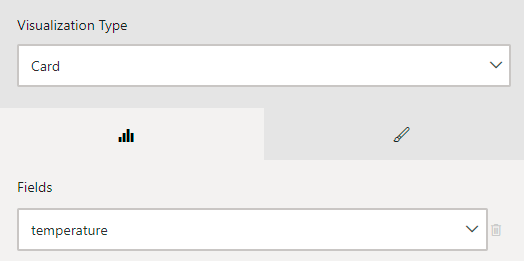
Part in the Power BI is done. You can customize your dashboard but all the work with pushing data is happening in the PowerShell script.
Next steps
You can loop PowerShell script execution with Windows batch file like this or if you are using R to get data from a data source, you can run PowerShell script directly from R.
If you need to show actual data only during working hours or another specific time interval, you can run tasks with the Windows batch file conditionally.
Power BI real time dashboard customization
One of the problems is that the visualizations for the streaming data set are limited.
You can deal with that by connecting to the streaming data set through the Power BI Desktop (use Power BI datasets) by using a live connection. The customized standard card or line chart works pretty well. You can play with the conditional formatting, shadows or transparency effects that you cant do by building a dashboard from the streaming dataset directly with allocated visualizations.

Leave a Reply