
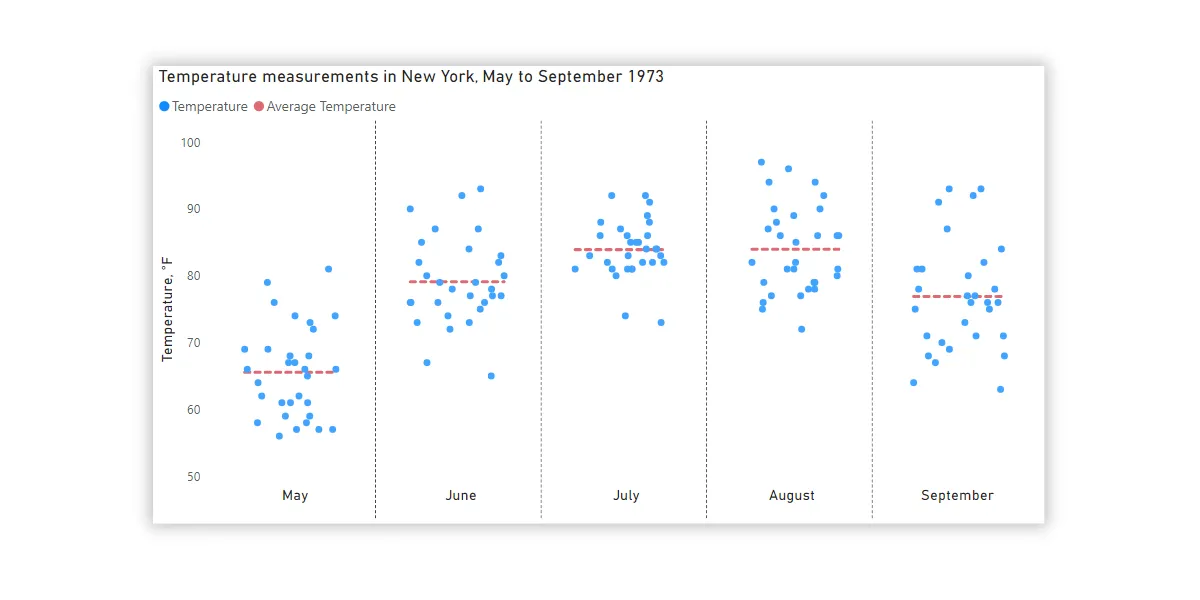
Here is how to create a jitter chart in Power BI with averages by categories and using only Power BI and DAX capabilities. No custom visualizations are necessary. A jitter chart makes it easier to view overlapping data points by categories.
R programming, Excel, DAX, Power BI
Here is how to create a jitter chart in Power BI with averages by categories and using only Power BI and DAX capabilities. No custom visualizations are necessary. A jitter chart makes it easier to view overlapping data points by categories.