Category: Excel

Top 6 Excel advanced filter tips and tricks
Here are my top 6 Excel advanced filter tips and tricks. It is a great tool to speed up and optimize filtering processes in Excel, and it is a good reason to master that more.
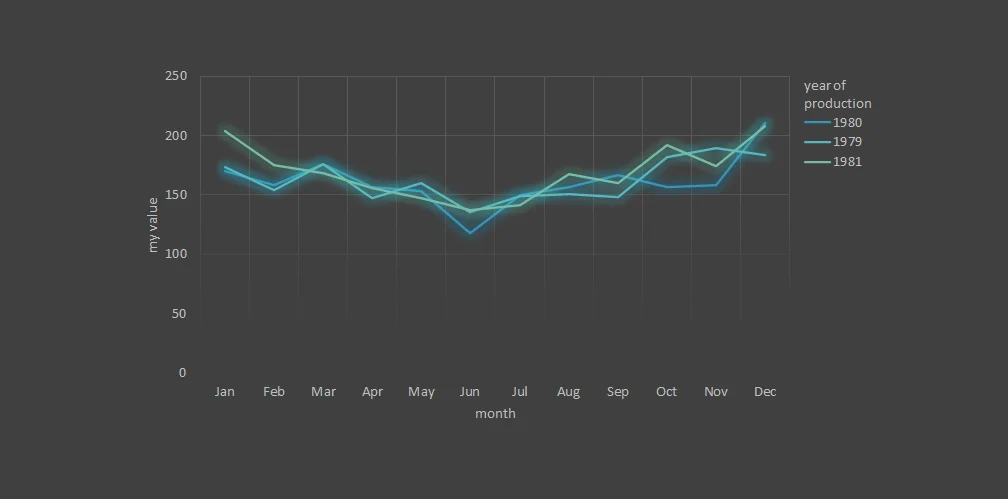
How to add legend title in Excel chart
At this moment, there is no default and easy way how to add a legend title in an Excel chart. The good news is that you can create that on your own. Here is a simple instruction on how to add legend titles in Excel efficiently.
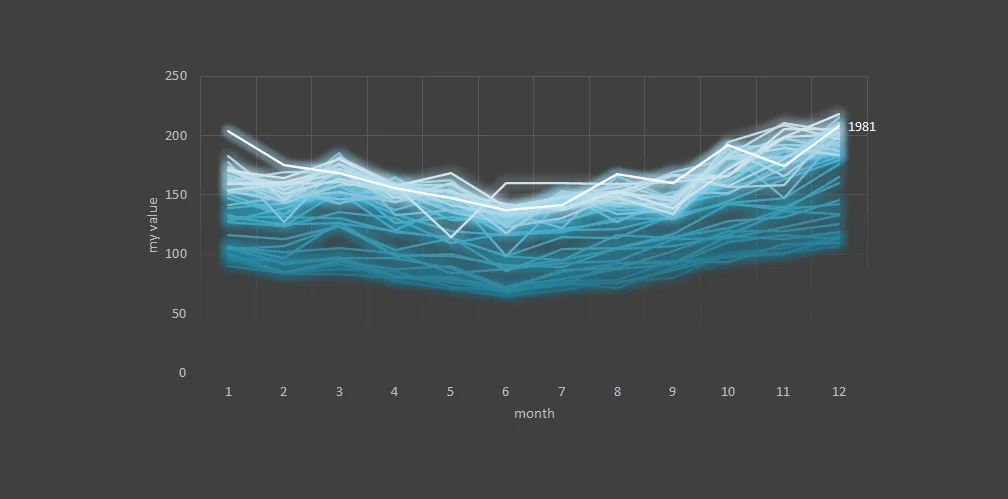
How to create a glowing line chart in Excel
Besides creating a glowing line chart in Excel, here is a possible solution how to deal with seemingly too many series in one plot. There might be different situations where you have to deal with many series. If you have some outliers in your data, this might work for you. Vizualtion has to explain the…

7 tips on how to speed up filtering in Excel
In large Excel spreadsheets, auto filters might work slowly and periodically crash. Here are 7 tips on how to speed up filtering in Excel and sometimes work with filters in general. When you have multiple filtering criteria or complex calculations that are involved typical Excel auto filter usage, it is not the best tool for…

Calculate weighted average in Excel PivotTable in 2 ways
Here are a few methods on how to calculate the weighted average in Excel PivotTable or DAX. It is not so simple as a weighted average by using calculation in an Excel worksheet. The good news is that you can use that method to validate your results.

How to connect to the Salesforce data with Power Query, Power BI, Excel
Here is how to connect to the Salesforce data with Power Query in Excel or Power BI. For the Salesforce CRM data exploration, I found Power Query very useful. There is no difference if you are using Power Query in Excel or Power BI. The steps to connect to the data with Power Query are…
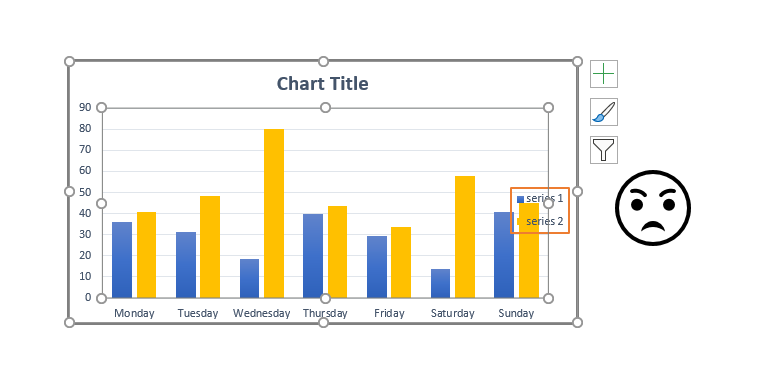
How to reset Excel chart plot area formatting
For me, the most annoying thing about Excel charts are is the inability to resize elements automatically. Usually, it happens after mild corrections of the plot area. Here is how to fix that and reset the Excel chart plot area to get back automatic size adjustments.

Color picker for Power BI or Excel
At this moment, there is no built-in color picker in Power BI or Excel, but here is how to use eyedropper PowerPoint. Eyedropper in PowerPoint is capable of detecting RGB and Hex color codes.

