The R rug plot using the ggplot2 package is an interesting way to add one-dimension marginal distribution in R to the plot. There are multiple ways how to use that, and here are a couple of examples in combination with a scatter plot.
Marginal distribution in R with rug plot
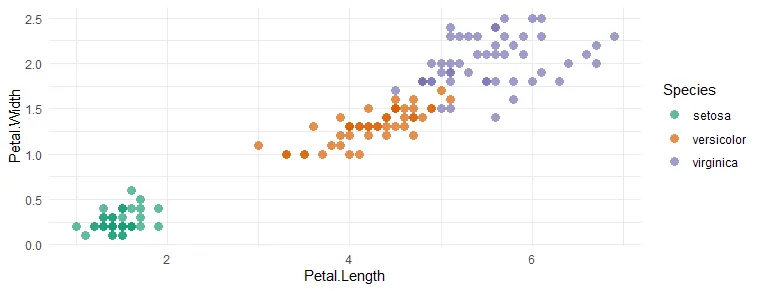
Here is my scatterplot without any marginal distribution plots, and it is based on the iris dataset.
require(ggplot2)


ggplot(iris, aes(x = Petal.Length, y = Petal.Width, color = Species)) +
  geom_point(size = 3, alpha = 0.7, shape = 16) +
  scale_color_brewer(palette = "Dark2") +
  theme_minimal()
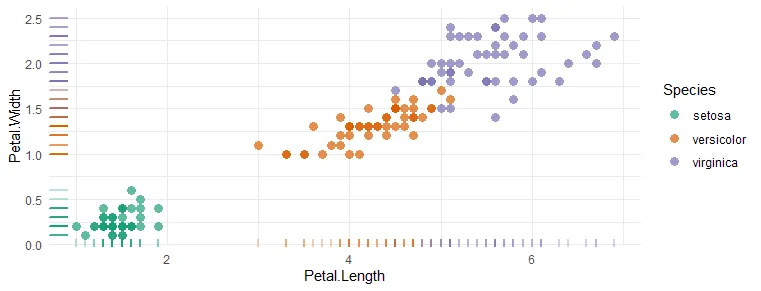
By using geom_rug from ggplot2, you can add one-dimensional marginal distribution horizontally and vertically, but it is adjustable. Here is a basic one.
ggplot(iris, aes(x = Petal.Length, y = Petal.Width, color = Species)) +
  geom_point(size = 3, alpha = 0.7, shape = 16) +
  geom_rug(size = 1, alpha = 0.3, show.legend = FALSE) +
  scale_color_brewer(palette = "Dark2") +
  theme_minimal()
In my case, rug plot colors are inherited. Colors are defined by different categories, but you can also specify them inside the rug plot. For example, if there is not necessary to look at data points by categories or you don’t have them, it looks like this.
set.seed(12345)

x <- c(rnorm(1000, mean = -1), rnorm(1000, mean = 1))

y <- c(rnorm(1000, mean = -1), rnorm(1000, mean = 1))

xy <- data.frame(x, y)


ggplot(data = xy, aes(x = x, y = y)) +
  geom_point(color = "#6667AB",
             size = 3,
             alpha = 0.3) +
  geom_rug(color = "sienna2", alpha = 0.2) +
  theme_minimal()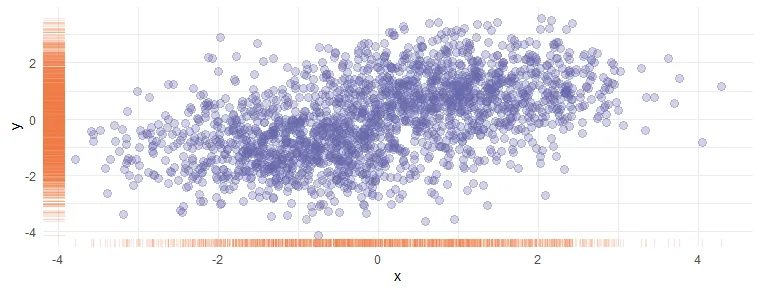
When you have more data points than in the iris data set, this kind of view of the marginal distribution seems more useful.
Change the position of the ggplot2 rug plot to show only vertically or horizontally
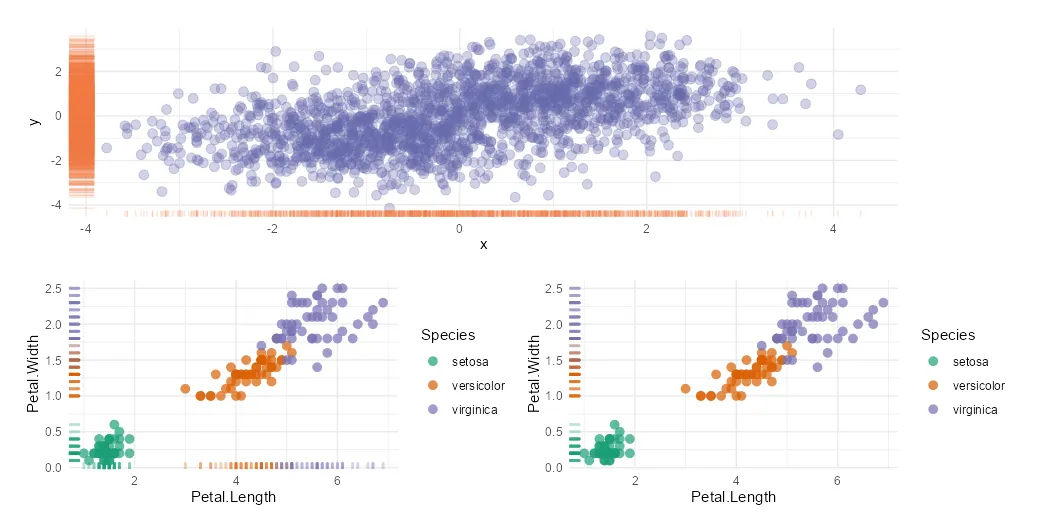
You can control the position of the ggplot2 rug plot by using the sides argument. Here is how it looks in all possible positions.
ggplot(iris, aes(x = Petal.Length, y = Petal.Width, color = Species)) +
  geom_point(size = 3, alpha = 0.7, shape = 16) +
  geom_rug(size = 1, alpha = 0.3, show.legend = FALSE, sides = "trbl") +
  scale_color_brewer(palette = "Dark2") +
  theme_minimal()

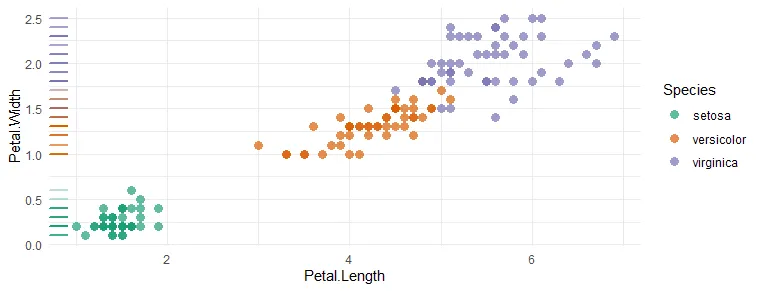
If you want to show the R rug plot only vertically, you can specify that like this.
ggplot(iris, aes(x = Petal.Length, y = Petal.Width, color = Species)) +
  geom_point(size = 3, alpha = 0.7, shape = 16) +
  geom_rug(size = 1, alpha = 0.3, show.legend = FALSE, sides = "l") +
  scale_color_brewer(palette = "Dark2") +
  theme_minimal()
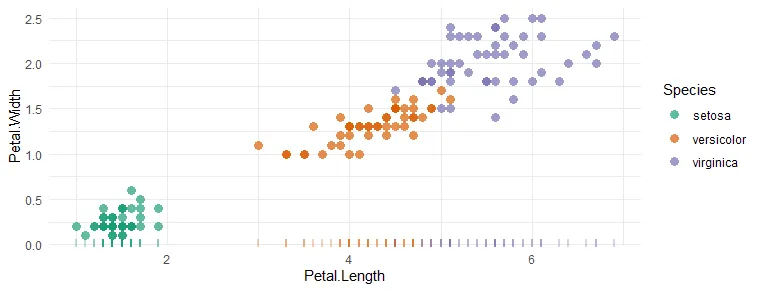
Here is how it looks if the ggplot2 rug plot is only above the horizontal axis.
ggplot(iris, aes(x = Petal.Length, y = Petal.Width, color = Species)) +
  geom_point(size = 3, alpha = 0.7, shape = 16) +
  geom_rug(size = 1, alpha = 0.3, show.legend = FALSE, sides = "b") +
  scale_color_brewer(palette = "Dark2") +
  theme_minimal()
Thank you for reading this post! Please take a look at other posts from this blog about data visualization or other stuff. For example, how to save R plots or other results temporarily or convert to WebP format.
Leave a Reply