Here is how to apply percentage format to decimal numbers in R and treat them as numeric. That is important if you would like to be able to do something relevant to numbers. For example, sorting by percentages or calculate the sum and get meaningful results.
If the number looks like a percentage, it might be visually appealing but might be problematic for calculations. Here is the problem. One of to popular approaches is the percent or label_percent function from the scales package.
It is useful for visualizations, but for further calculations, it is not. Here is what the result of the sum looks like.
df <- data.frame("my_num" = c(0.555, 0.255, 0.190))

df$as_pct <- scales::percent(df$my_num)

df
#  my_num as_pct
#1  0.555  55.5%
#2  0.255  25.5%
#3  0.190  19.0%

class(df$as_pct)
#[1] "character"

sum(df$as_pct)
#Error in sum(df$as_pct) : invalid 'type' (character) of argument
Keep number properties after applying percentage format in R
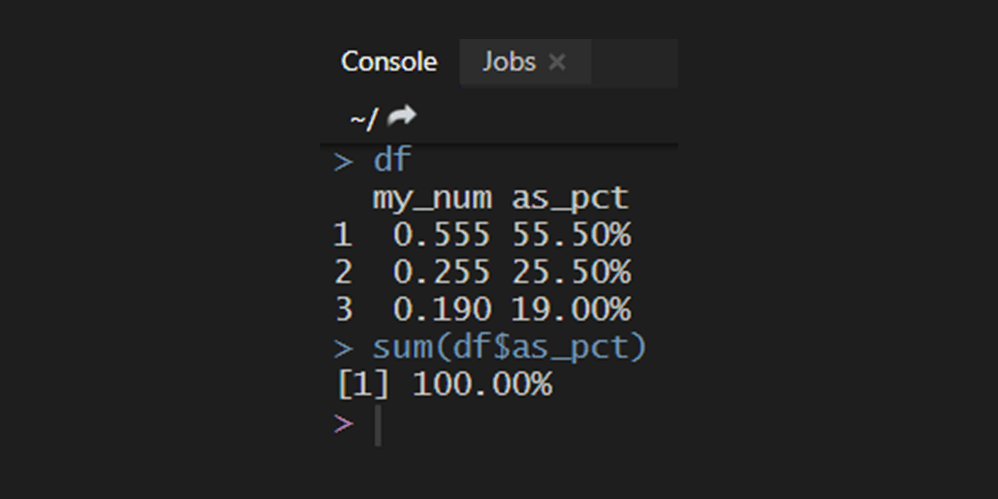
The best approach to get percentage format and keep number properties is by using the percent function from the formattable library. By using this function, you will get a percentage format and be able to treat the result as numerical.
df <- data.frame("my_num" = c(0.555, 0.255, 0.190))

df$as_pct <- formattable::percent(df$my_num)

df
#  my_num as_pct
#1  0.555 55.50%
#2  0.255 25.50%
#3  0.190 19.00%

class(df$as_pct)
#[1] "formattable" "numeric"

sum(df$as_pct)
#[1] 100.00%
As you can see, I can summarize those values without any problem.
You can convert from percentage format to numeric.
> as.numeric(df$as_pct)
#[1] 0.555 0.255 0.190
Sometimes during calculations are values where scientific notation appears. Here is how to convert numbers with a scientific notation to decimal in R.
Another useful feature for number formatting might be leading zeros. Here is how to add them in R.

Leave a Reply