Tag: boxplot stripchart r
How to create a jitter plot in R with ggplot2, plotly, and base
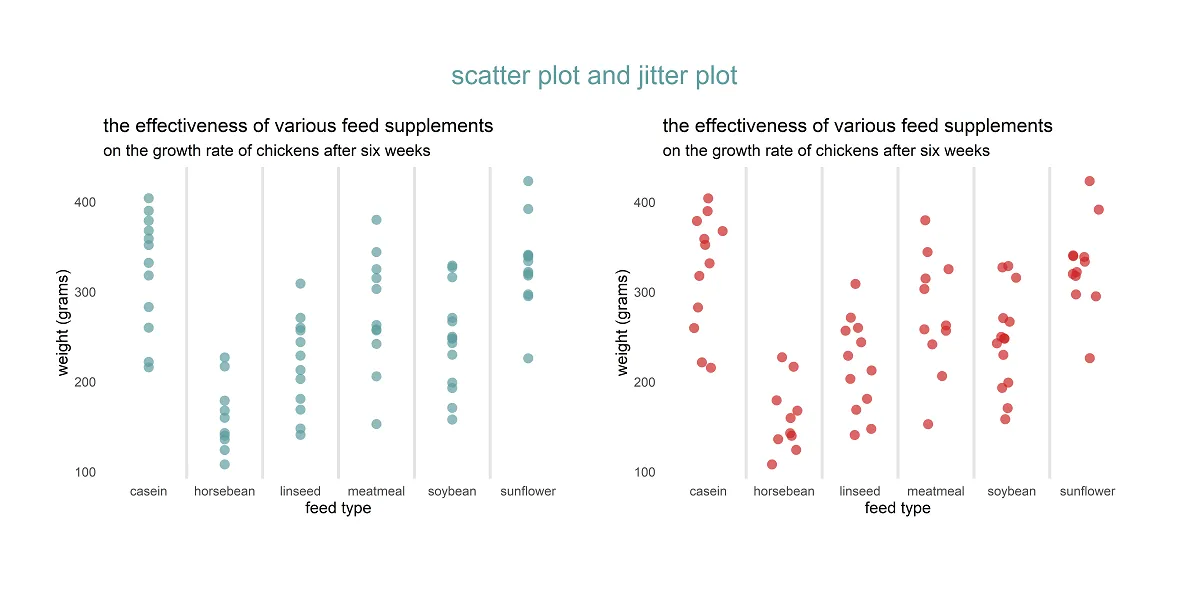
Here are 3 ways to create a jitter plot in R, also called a strip chart or a dot plot which is a one-dimensional scatter plot. A jitter plot in R makes it easier to view overlapping data points by categorical or discrete values. In that scenario, the scatter plot groups all data points in…