Get the first and last row of the data group in R
If your data frame content is categorized and you are interested to extract the first and the last row of each group in R, this post is for you. It is a useful solution to detect the minimum and the maximum by a group in big data sets. In my experience, it works faster than…
in
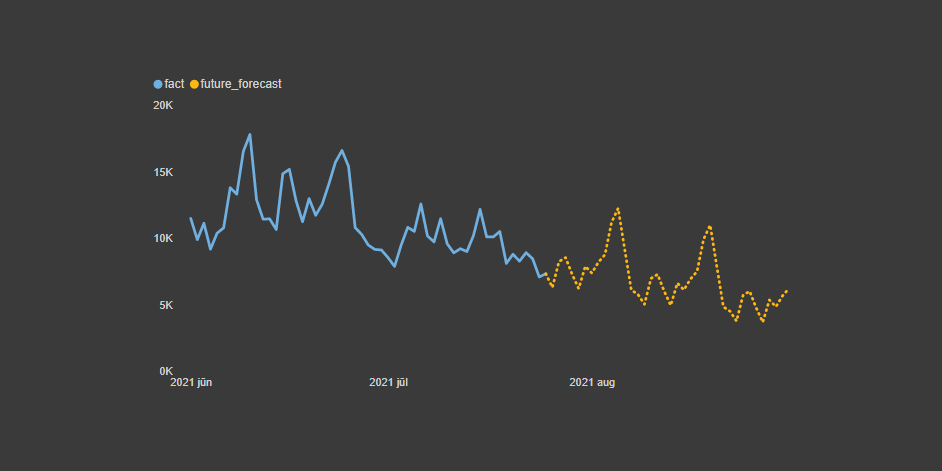
Power BI line chart that conditionally changes formatting
Here is how to create a Power BI line chart that at some point continues in a different design, formatting. For example, it is useful to continue actual data with the forecast but in a different style. In a way, it is conditional formatting for the line chart series in a Power BI.
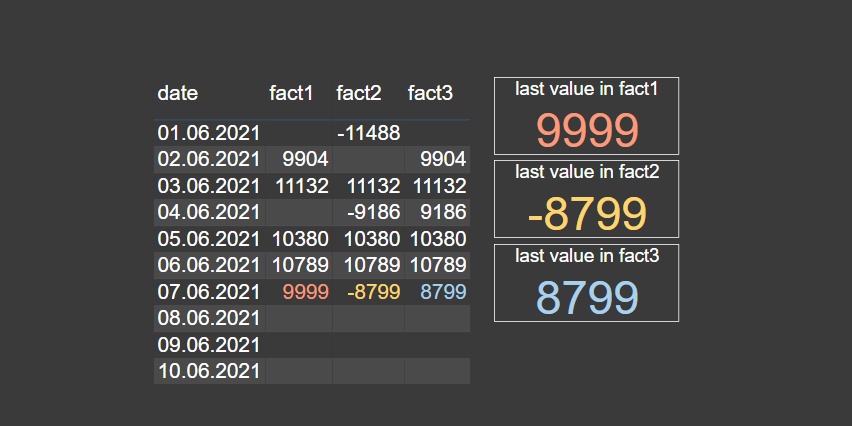
Last available column value in Power BI
Here is how to detect the last available column value in Power BI in almost any situation. The main problem is columns with missing values in one or multiple places. But if your data contains something that represents a sequence, for example, date or index column, there is a simple solution.
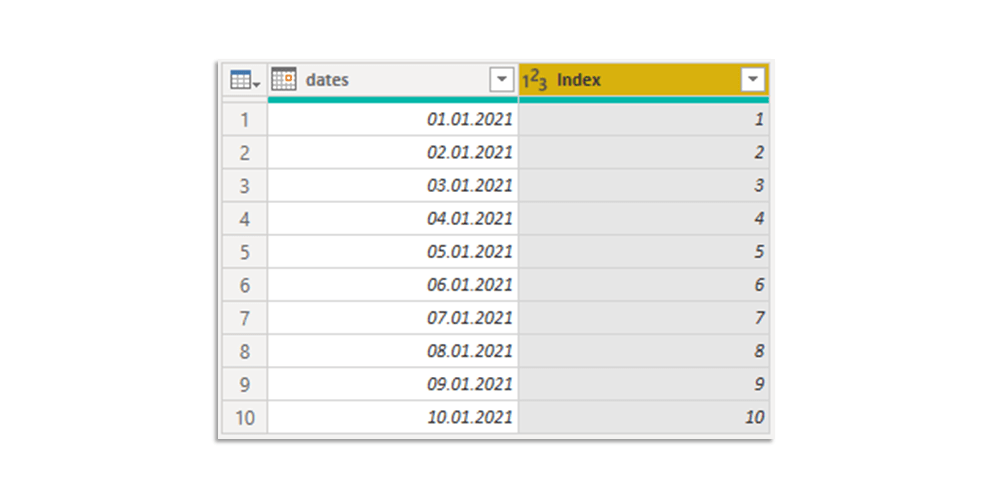
Add index column in Power Query
Here is how to add an index column in Power Query in 2 easy steps. Index column in Power Query might be useful in data manipulations like returning next or previous record. It could be done in Excel or Power BI because they both share this great tool.
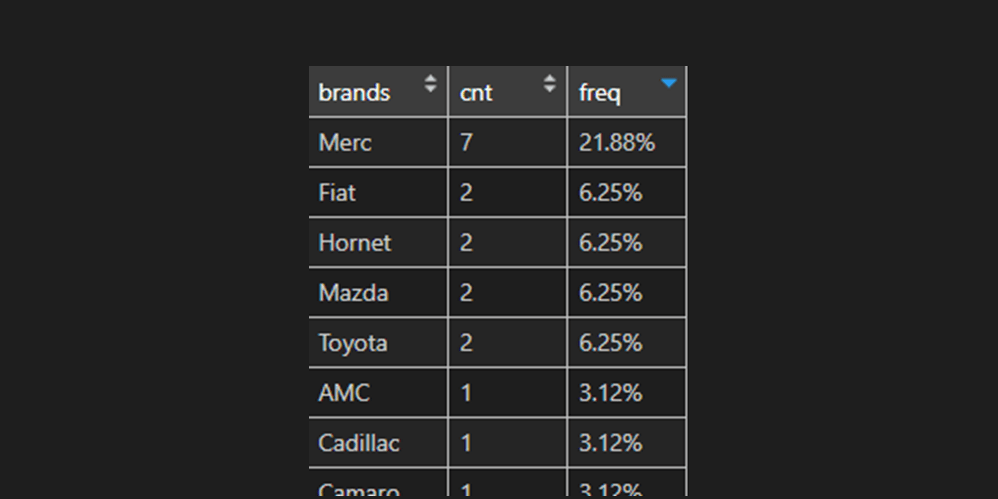
Calculate the percentage by a group in R, dplyr
Here is how to calculate the percentage by group or subgroup in R. If you like, you can add percentage formatting, then there is no problem, but take a quick look at this post to understand the result you might get.
in
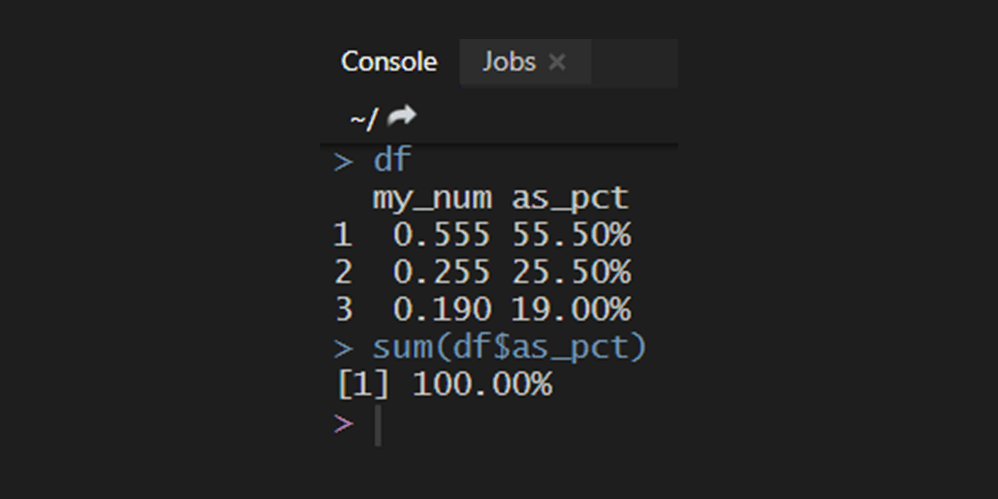
Percentage format in R
Here is how to apply percentage format to decimal numbers in R and treat them as numeric. That is important if you would like to be able to do something relevant to numbers. For example, sorting by percentages or calculate the sum and get meaningful results.
in
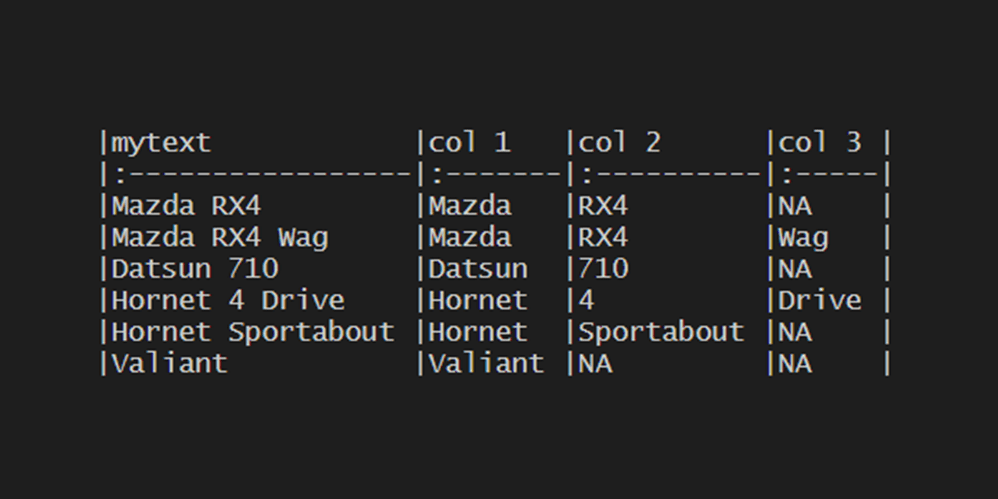
How to split one column into multiple columns in R
If you want to split one data frame column into multiple in R, then here is how to do that in 3 different ways.
in
Control Power BI DAX measures with a slicer
It is easy to control Power BI DAX measures with a slicer and turn them on or off for visualizations or other purposes. Here is how to do that in 4 easy steps.
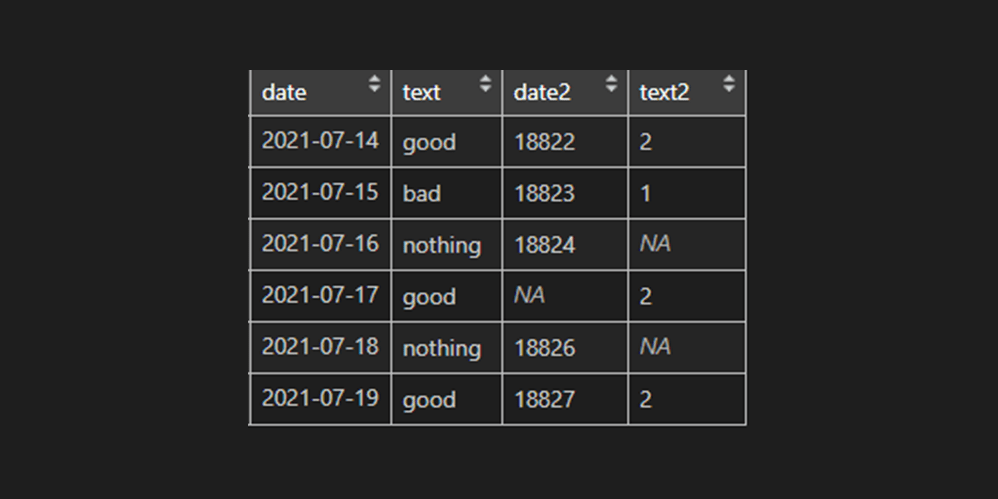
Problem with different format after using ifelse in R
Sometimes you might get results in a different format after using ifelse in R. Usually when returning NA in the results or something from a different data type. Here is how to fix that or use alternatives.
in
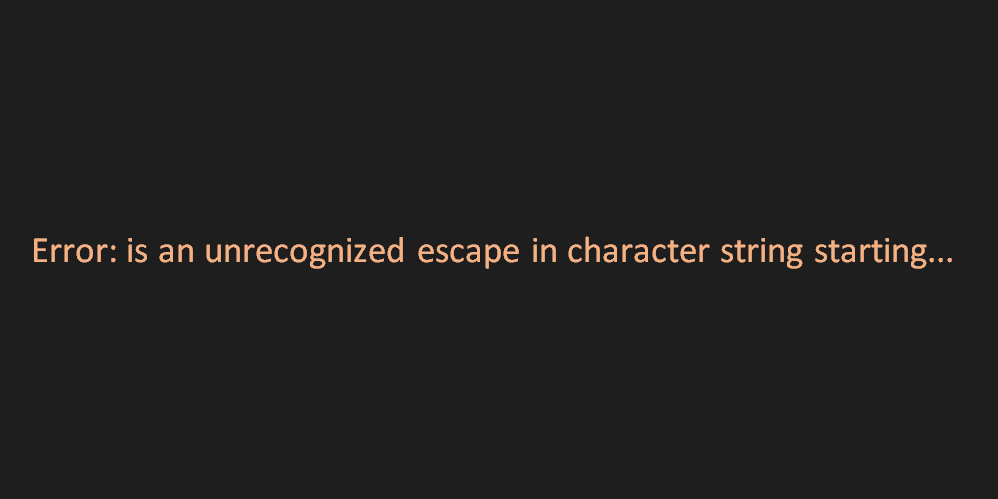
How to fix Windows path to use it in R
In R, you cant use Windows file or folder path straight forward. The direction of the slash symbols is critical, and here is how to quickly fix the Windows path to use it in R.
in