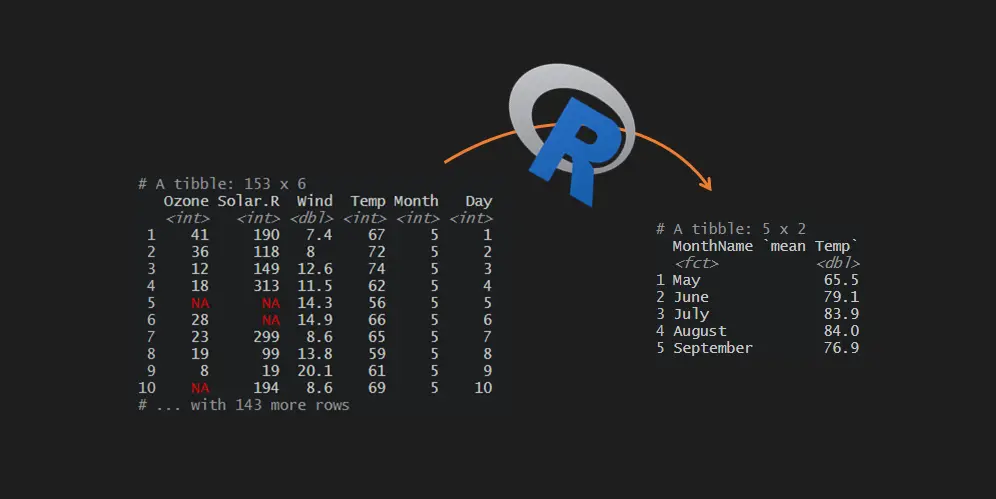
Here is how to calculate the mean by a group in R. If you are an Excel, user you might prefer to say average by a group in R. This post contains multiple scenarios that will ensure that you know some of the pitfalls and tricks.
I will use the airquality dataset, which is available in R. This dataset contains columns like temperature with necessary values to calculate the mean by month. Some columns contain NA values, which might be a pitfall in mean calculations, and it is necessary to specify if you want to ignore them.
data("airquality")


head(airquality)

#  Ozone Solar.R Wind Temp Month Day
#1    41     190  7.4   67     5   1
#2    36     118  8.0   72     5   2
#3    12     149 12.6   74     5   3
#4    18     313 11.5   62     5   4
#5    NA      NA 14.3   56     5   5
#6    28      NA 14.9   66     5   6
Mean by a group in R
To do necessary calculations by a group, I will use the group_by function from dplyr. It helps to do other calculations similarly, for example, minimum or maximum by group or percentage by a group.
require(dplyr)


airquality %>%
  group_by(Month) %>%
  summarise("mean Temp" = mean(Temp))

## A tibble: 5 x 2
#  Month `mean Temp`
#
#1     5        65.5
#2     6        79.1
#3     7        83.9
#4     8        84.0
#5     9        76.9
Be careful if the column that you are using to calculate the mean by the group in R contains NA values. Use the na.rm parameter in the mean function if you want to avoid them.
airquality %>%
  group_by(Month) %>%
  summarise("mean Solar.R" = mean(Solar.R))

## A tibble: 5 x 2
#  Month `mean Solar.R`
#
#1     5            NA
#2     6           190.
#3     7           216.
#4     8            NA
#5     9           167.


airquality %>%
  group_by(Month) %>%
  summarise("mean Solar.R" = mean(Solar.R, na.rm = TRUE))

## A tibble: 5 x 2
#  Month `mean Solar.R`
#
#1     5           181.
#2     6           190.
#3     7           216.
#4     8           172.
#5     9           167.
Get mean by a group in a separate column in the unsummarised data set
If you want to calculate the mean by a group in R but don’t want to get the results in a summarised dataset, here is how to do that.
airquality %>%
  group_by(Month) %>%
  mutate("mean Temp" = mean(Temp)) %>%
  head()


## A tibble: 6 x 7
## Groups:   Month [1]
#  Ozone Solar.R  Wind  Temp Month   Day `mean Temp`
#
#1    41     190   7.4    67     5     1        65.5
#2    36     118   8      72     5     2        65.5
#3    12     149  12.6    74     5     3        65.5
#4    18     313  11.5    62     5     4        65.5
#5    NA      NA  14.3    56     5     5        65.5
#6    28      NA  14.9    66     5     6        65.5
Mean by the group that doesn’t exist yet
Here is an interesting way to use the group_by function. If you don’t have content you want to use for grouping, you can create one inside group_by.
For example, in this data frame is a column with a month as s numeric value. You might want to convert the month number to the month name and use that instead.
airquality %>%
  group_by("MonthName" = month.name[airquality$Month]) %>%
  summarise("mean Temp" = mean(Temp))

## A tibble: 5 x 2
#  MonthName `mean Temp`
#
#1 August           84.0
#2 July             83.9
#3 June             79.1
#4 May              65.5
#5 September        76.9
It is important to sort month names as they are during the year. In that case, you have to sort text as numbers in R.
airquality %>%
  group_by("MonthName" =
             factor(airquality$Month, labels = unique(month.name[airquality$Month]))) %>%
  summarise("mean Temp" = mean(Temp))

## A tibble: 5 x 2
#  MonthName `mean Temp`
#
#1 May              65.5
#2 June             79.1
#3 July             83.9
#4 August           84.0
#5 September        76.9
Besides this unusual group_by use case, there are other dplyr tips and tricks that you might be interested in.
Data in the airqaulity dataset is from 1973. Here is how to create a combination with year and month in R and use that mean by group calculation.
First of all, with the help of lubridate package, I will join the necessary components into the date and, after that, change the format.
require(lubridate)

airquality %>%
  group_by("Year and Month" = format(make_date(1973, Month, 1), '%B-%Y')) %>%
  summarise("mean Temp" = mean(Temp))

## A tibble: 5 x 2
#  `Year and Month` `mean Temp`
#
#1 August-1973             84.0
#2 July-1973               83.9
#3 June-1973               79.1
#4 May-1973                65.5
#5 September-1973          76.9
Here is a good cheat sheet that contains date formatting options in R that might be useful in other situations.
In this blog, you can find other helpful calculations by a group. For example:

Leave a Reply