Here is a quick and easy way hot to get the maximum or minimum value within each group in R in separate columns. Let’s take a look at the data set with NA values, which makes it a little bit harder.
First of all, you will need a dplyr package.
Let’s return maximum and minimum mass by gender from the starwars dataset. Here is how to select the needed columns.
require(dplyr)

gender_mass <- starwars %>% select(gender, mass)
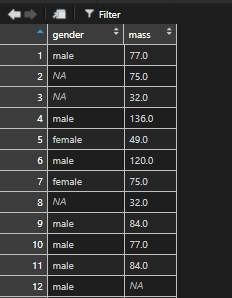
As you can see, there are NA values within gender and mass columns. One way how to deal with them is filter data or replace NA, but we will use na.rm argument in min, max functions.
Calculate maximum and minimum in R and return all data frame values
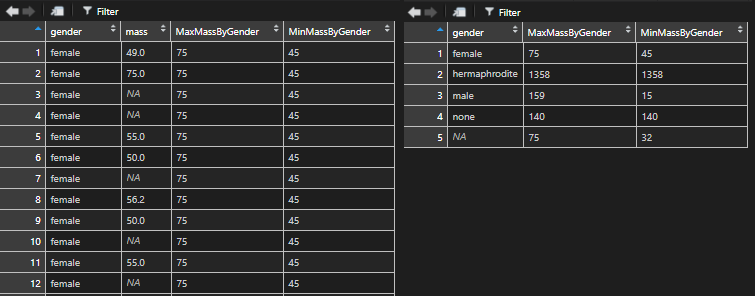
To extract maximum and minimum value by group in R, we will use a mutate function that will add a new column with the result of each calculation by the group.
require(dplyr)

gender_mass <- starwars %>% select(gender, mass)

gender_mass1 <- gender_mass %>%
  group_by(gender) %>%
  mutate(
    MaxMassByGender = max(mass, na.rm = T),
    MinMassByGender = min(mass, na.rm = T)
  ) %>%
  arrange(gender)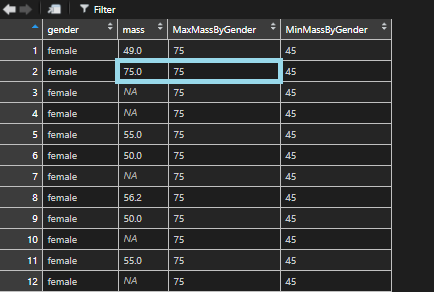
Calculate maximum and minimum in R and return grouped data frame values
If you want to return these calculations and see grouped values, then summarise will do the trick.
require(dplyr)

gender_mass <- starwars %>% select(gender, mass)

gender_mass2 <- gender_mass %>%
  group_by(gender) %>%
  summarise(
    MaxMassByGender = max(mass, na.rm = T),
    MinMassByGender = min(mass, na.rm = T)
  ) %>%
  arrange(gender)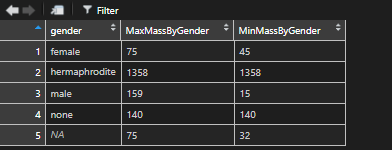
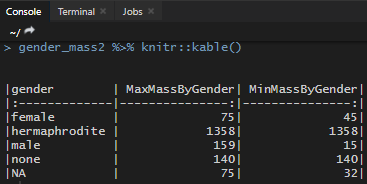
To get results as a beautifully formatted table in console, try to use kable function from knitr package.
If you want to know how to reflow your code or other useful RStudio tips and tricks, take a look at this post.
For a quick and easy way to copy results from R to Excel, take a look at this solution.
Leave a Reply